Data
486,620 items of data are available, covering 468,668 participants.
Defined-instances run from 0 to 1, labelled using Instancing
2.
Units of measurement are percent.
| Maximum | 97.0224 |
| Decile 9 | 25.234 |
| Decile 8 | 19.5927 |
| Decile 7 | 17.1556 |
| Decile 6 | 15.6337 |
| Median | 14.4933 |
| Decile 4 | 13.5374 |
| Decile 3 | 12.622 |
| Decile 2 | 11.626 |
| Decile 1 | 10.275 |
| Minimum | 0.00649557 |
|
|
- Mean = 16.8659
- Std.dev = 9.1848
- 16118 items above graph maximum of 40.193
|
2 Instances
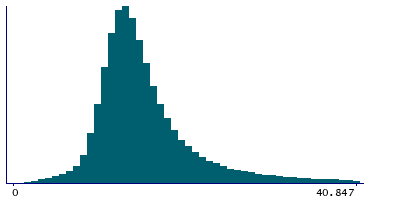
Instance 0 : Initial assessment visit (2006-2010) at which participants were recruited and consent given
467,515 participants, 467,515 items
| Maximum | 97.0224 |
| Decile 9 | 25.295 |
| Decile 8 | 19.626 |
| Decile 7 | 17.1807 |
| Decile 6 | 15.653 |
| Median | 14.511 |
| Decile 4 | 13.5549 |
| Decile 3 | 12.6411 |
| Decile 2 | 11.646 |
| Decile 1 | 10.297 |
| Minimum | 0.00649557 |
|

|
- Mean = 16.8978
- Std.dev = 9.20911
- 15538 items above graph maximum of 40.293
|
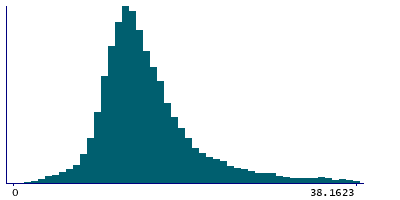
Instance 1 : First repeat assessment visit (2012-13)
19,105 participants, 19,105 items
| Maximum | 91.756 |
| Decile 9 | 23.763 |
| Decile 8 | 18.752 |
| Decile 7 | 16.573 |
| Decile 6 | 15.167 |
| Median | 14.0205 |
| Decile 4 | 13.063 |
| Decile 3 | 12.163 |
| Decile 2 | 11.139 |
| Decile 1 | 9.78747 |
| Minimum | 1.5331 |
|
|
- Mean = 16.0854
- Std.dev = 8.53137
- 601 items above graph maximum of 37.7385
|


