Data
486,620 items of data are available, covering 468,668 participants.
Defined-instances run from 0 to 1, labelled using Instancing
2.
Units of measurement are percent.
| Maximum | 99.982 |
| Decile 9 | 42.79 |
| Decile 8 | 34.0696 |
| Decile 7 | 30.309 |
| Decile 6 | 27.9915 |
| Median | 26.286 |
| Decile 4 | 24.888 |
| Decile 3 | 23.593 |
| Decile 2 | 22.215 |
| Decile 1 | 20.3933 |
| Minimum | 1.52724 |
|

|
- Mean = 29.8879
- Std.dev = 12.6586
- 17144 items above graph maximum of 65.1867
|
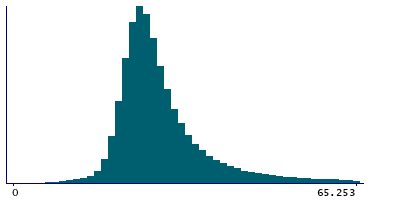
2 Instances
Instance 0 : Initial assessment visit (2006-2010) at which participants were recruited and consent given
467,515 participants, 467,515 items
| Maximum | 99.9569 |
| Decile 9 | 42.8739 |
| Decile 8 | 34.103 |
| Decile 7 | 30.3343 |
| Decile 6 | 28.0086 |
| Median | 26.3028 |
| Decile 4 | 24.905 |
| Decile 3 | 23.6104 |
| Decile 2 | 22.234 |
| Decile 1 | 20.414 |
| Minimum | 1.52724 |
|
|
- Mean = 29.9202
- Std.dev = 12.6832
- 16484 items above graph maximum of 65.3338
|
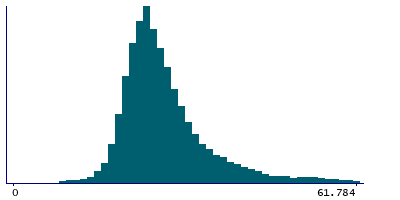
Instance 1 : First repeat assessment visit (2012-13)
19,105 participants, 19,105 items
| Maximum | 99.982 |
| Decile 9 | 40.909 |
| Decile 8 | 33.2009 |
| Decile 7 | 29.7164 |
| Decile 6 | 27.565 |
| Median | 25.903 |
| Decile 4 | 24.444 |
| Decile 3 | 23.1912 |
| Decile 2 | 21.7319 |
| Decile 1 | 19.927 |
| Minimum | 4.6657 |
|
|
- Mean = 29.0983
- Std.dev = 12.0147
- 648 items above graph maximum of 61.891
|


