Data
486,620 items of data are available, covering 468,668 participants.
Defined-instances run from 0 to 1, labelled using Instancing
2.
Units of measurement are percent.
| Maximum | 56.4931 |
| Decile 9 | 18.7061 |
| Decile 8 | 17.3198 |
| Decile 7 | 16.6556 |
| Decile 6 | 16.1792 |
| Median | 15.765 |
| Decile 4 | 15.3504 |
| Decile 3 | 14.874 |
| Decile 2 | 14.2033 |
| Decile 1 | 12.4978 |
| Minimum | 0.00054101 |
|
|
- Mean = 15.4004
- Std.dev = 4.27777
- 24735 items below graph minimum of 6.2896
- 7971 items above graph maximum of 24.9144
|
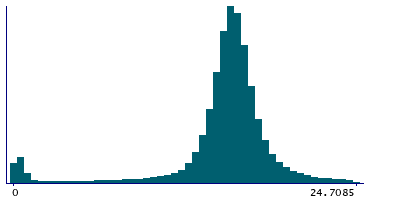
2 Instances
Instance 0 : Initial assessment visit (2006-2010) at which participants were recruited and consent given
467,515 participants, 467,515 items
| Maximum | 56.4931 |
| Decile 9 | 18.709 |
| Decile 8 | 17.3233 |
| Decile 7 | 16.66 |
| Decile 6 | 16.1832 |
| Median | 15.77 |
| Decile 4 | 15.356 |
| Decile 3 | 14.8809 |
| Decile 2 | 14.212 |
| Decile 1 | 12.508 |
| Minimum | 0.00054101 |
|

|
- Mean = 15.4049
- Std.dev = 4.27719
- 23837 items below graph minimum of 6.307
- 7674 items above graph maximum of 24.91
|
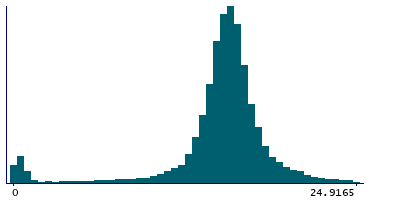
Instance 1 : First repeat assessment visit (2012-13)
19,105 participants, 19,105 items
| Maximum | 43.2218 |
| Decile 9 | 18.647 |
| Decile 8 | 17.232 |
| Decile 7 | 16.5598 |
| Decile 6 | 16.073 |
| Median | 15.644 |
| Decile 4 | 15.205 |
| Decile 3 | 14.717 |
| Decile 2 | 13.992 |
| Decile 1 | 12.2525 |
| Minimum | 0.00091324 |
|
|
- Mean = 15.2887
- Std.dev = 4.29028
- 297 items above graph maximum of 25.0415
|


