Data
507,960 items of data are available, covering 488,512 participants.
Defined-instances run from 0 to 1, labelled using Instancing
2.
Units of measurement are mmol/l.
| Maximum | 0.852117 |
| Decile 9 | 0.39882 |
| Decile 8 | 0.37576 |
| Decile 7 | 0.35998 |
| Decile 6 | 0.346965 |
| Median | 0.3351 |
| Decile 4 | 0.323368 |
| Decile 3 | 0.311179 |
| Decile 2 | 0.296972 |
| Decile 1 | 0.27737 |
| Minimum | 1.6347e-07 |
|

|
- Mean = 0.336973
- Std.dev = 0.0490464
- 240 items below graph minimum of 0.15592
- 766 items above graph maximum of 0.52027
|
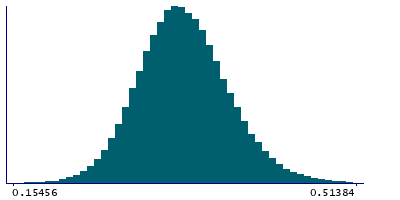
2 Instances
Instance 0 : Initial assessment visit (2006-2010) at which participants were recruited and consent given
488,083 participants, 488,083 items
| Maximum | 0.852117 |
| Decile 9 | 0.398905 |
| Decile 8 | 0.375864 |
| Decile 7 | 0.36008 |
| Decile 6 | 0.347066 |
| Median | 0.33519 |
| Decile 4 | 0.323467 |
| Decile 3 | 0.311273 |
| Decile 2 | 0.29707 |
| Decile 1 | 0.277478 |
| Minimum | 1.6347e-07 |
|
|
- Mean = 0.337061
- Std.dev = 0.0490221
- 233 items below graph minimum of 0.156051
- 709 items above graph maximum of 0.520332
|
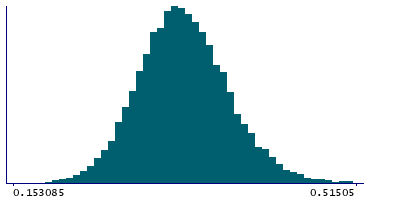
Instance 1 : First repeat assessment visit (2012-13)
19,877 participants, 19,877 items
| Maximum | 0.70423 |
| Decile 9 | 0.39635 |
| Decile 8 | 0.373425 |
| Decile 7 | 0.35759 |
| Decile 6 | 0.344475 |
| Median | 0.332505 |
| Decile 4 | 0.32102 |
| Decile 3 | 0.308745 |
| Decile 2 | 0.294721 |
| Decile 1 | 0.274945 |
| Minimum | 0.077126 |
|
|
- Mean = 0.334815
- Std.dev = 0.0495922
- 7 items below graph minimum of 0.15354
- 57 items above graph maximum of 0.517755
|


