Data
507,960 items of data are available, covering 488,512 participants.
Defined-instances run from 0 to 1, labelled using Instancing
2.
Units of measurement are mmol/l.
| Maximum | 1.37565 |
| Decile 9 | 0.553499 |
| Decile 8 | 0.50094 |
| Decile 7 | 0.46506 |
| Decile 6 | 0.43528 |
| Median | 0.40875 |
| Decile 4 | 0.383232 |
| Decile 3 | 0.357483 |
| Decile 2 | 0.329665 |
| Decile 1 | 0.294721 |
| Minimum | 1.196e-07 |
|
|
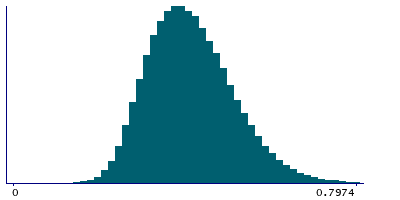
- Mean = 0.417947
- Std.dev = 0.102316
- 621 items above graph maximum of 0.812277
|
2 Instances
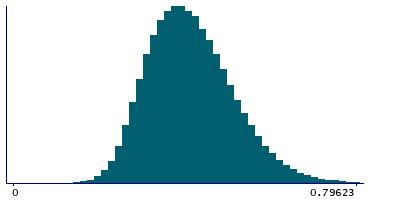
Instance 0 : Initial assessment visit (2006-2010) at which participants were recruited and consent given
488,083 participants, 488,083 items
| Maximum | 1.37565 |
| Decile 9 | 0.553131 |
| Decile 8 | 0.500607 |
| Decile 7 | 0.4646 |
| Decile 6 | 0.434777 |
| Median | 0.40831 |
| Decile 4 | 0.38277 |
| Decile 3 | 0.35704 |
| Decile 2 | 0.329252 |
| Decile 1 | 0.294305 |
| Minimum | 1.196e-07 |
|
|
- Mean = 0.41752
- Std.dev = 0.102321
- 586 items above graph maximum of 0.811957
|
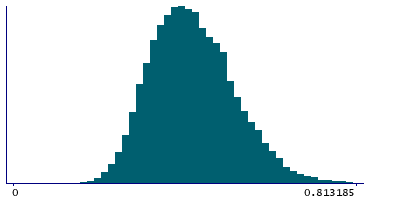
Instance 1 : First repeat assessment visit (2012-13)
19,877 participants, 19,877 items
| Maximum | 1.2217 |
| Decile 9 | 0.56211 |
| Decile 8 | 0.509772 |
| Decile 7 | 0.476288 |
| Decile 6 | 0.44648 |
| Median | 0.419995 |
| Decile 4 | 0.394185 |
| Decile 3 | 0.368375 |
| Decile 2 | 0.340551 |
| Decile 1 | 0.305766 |
| Minimum | 0.12665 |
|
|
- Mean = 0.428432
- Std.dev = 0.101623
- 34 items above graph maximum of 0.818454
|


