Data
507,960 items of data are available, covering 488,512 participants.
Defined-instances run from 0 to 1, labelled using Instancing
2.
Units of measurement are mmol/l.
| Maximum | 1.42908 |
| Decile 9 | 0.630887 |
| Decile 8 | 0.5788 |
| Decile 7 | 0.54398 |
| Decile 6 | 0.515506 |
| Median | 0.48994 |
| Decile 4 | 0.46528 |
| Decile 3 | 0.43953 |
| Decile 2 | 0.41104 |
| Decile 1 | 0.37361 |
| Minimum | 3.2609e-05 |
|

|
- Mean = 0.497855
- Std.dev = 0.103082
- 955 items above graph maximum of 0.888164
|
2 Instances
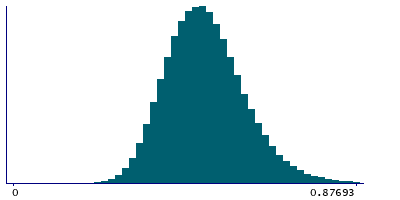
Instance 0 : Initial assessment visit (2006-2010) at which participants were recruited and consent given
488,083 participants, 488,083 items
| Maximum | 1.42908 |
| Decile 9 | 0.630622 |
| Decile 8 | 0.57849 |
| Decile 7 | 0.543661 |
| Decile 6 | 0.515205 |
| Median | 0.489591 |
| Decile 4 | 0.46492 |
| Decile 3 | 0.43919 |
| Decile 2 | 0.41068 |
| Decile 1 | 0.37326 |
| Minimum | 3.2609e-05 |
|
|
- Mean = 0.497538
- Std.dev = 0.103128
- 912 items above graph maximum of 0.887985
|
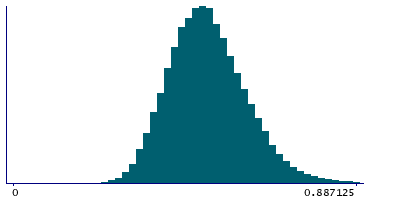
Instance 1 : First repeat assessment visit (2012-13)
19,877 participants, 19,877 items
| Maximum | 1.2091 |
| Decile 9 | 0.636665 |
| Decile 8 | 0.586071 |
| Decile 7 | 0.551455 |
| Decile 6 | 0.522956 |
| Median | 0.49809 |
| Decile 4 | 0.473555 |
| Decile 3 | 0.448269 |
| Decile 2 | 0.420065 |
| Decile 1 | 0.38325 |
| Minimum | 0.2114 |
|
|
- Mean = 0.505656
- Std.dev = 0.101637
- 45 items above graph maximum of 0.89008
|


