Data
507,960 items of data are available, covering 488,512 participants.
Defined-instances run from 0 to 1, labelled using Instancing
2.
Units of measurement are mmol/l.
| Maximum | 0.244256 |
| Decile 9 | 0.046641 |
| Decile 8 | 0.0397061 |
| Decile 7 | 0.035286 |
| Decile 6 | 0.031809 |
| Median | 0.0288577 |
| Decile 4 | 0.026124 |
| Decile 3 | 0.023425 |
| Decile 2 | 0.020548 |
| Decile 1 | 0.016959 |
| Minimum | 2.9468e-07 |
|

|
- Mean = 0.0307163
- Std.dev = 0.0124041
- 2467 items above graph maximum of 0.076323
|
2 Instances
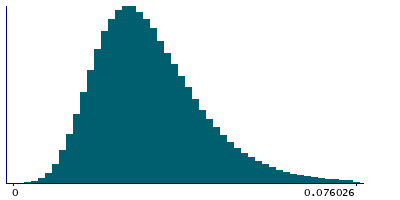
Instance 0 : Initial assessment visit (2006-2010) at which participants were recruited and consent given
488,083 participants, 488,083 items
| Maximum | 0.244256 |
| Decile 9 | 0.046653 |
| Decile 8 | 0.0397085 |
| Decile 7 | 0.035276 |
| Decile 6 | 0.031797 |
| Median | 0.028846 |
| Decile 4 | 0.026109 |
| Decile 3 | 0.02341 |
| Decile 2 | 0.02053 |
| Decile 1 | 0.01694 |
| Minimum | 2.9468e-07 |
|
|
- Mean = 0.030711
- Std.dev = 0.0124273
- 2398 items above graph maximum of 0.076366
|
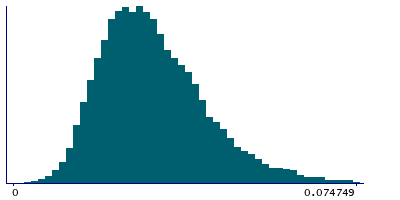
Instance 1 : First repeat assessment visit (2012-13)
19,877 participants, 19,877 items
| Maximum | 0.13224 |
| Decile 9 | 0.0463125 |
| Decile 8 | 0.039652 |
| Decile 7 | 0.035501 |
| Decile 6 | 0.0320855 |
| Median | 0.029123 |
| Decile 4 | 0.0265125 |
| Decile 3 | 0.0237807 |
| Decile 2 | 0.020962 |
| Decile 1 | 0.0174705 |
| Minimum | 0.0022075 |
|
|
- Mean = 0.0308462
- Std.dev = 0.011821
- 65 items above graph maximum of 0.0751545
|


