Data
507,960 items of data are available, covering 488,512 participants.
Defined-instances run from 0 to 1, labelled using Instancing
2.
Units of measurement are mmol/l.
| Maximum | 1.3187 |
| Decile 9 | 0.42121 |
| Decile 8 | 0.33621 |
| Decile 7 | 0.279341 |
| Decile 6 | 0.235773 |
| Median | 0.200014 |
| Decile 4 | 0.16952 |
| Decile 3 | 0.142219 |
| Decile 2 | 0.11611 |
| Decile 1 | 0.086879 |
| Minimum | 7.9755e-09 |
|

|
- Mean = 0.230753
- Std.dev = 0.135223
- 1092 items above graph maximum of 0.755541
|
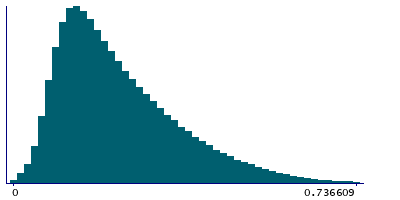
2 Instances
Instance 0 : Initial assessment visit (2006-2010) at which participants were recruited and consent given
488,083 participants, 488,083 items
| Maximum | 1.3187 |
| Decile 9 | 0.41989 |
| Decile 8 | 0.33488 |
| Decile 7 | 0.278191 |
| Decile 6 | 0.23471 |
| Median | 0.199086 |
| Decile 4 | 0.16877 |
| Decile 3 | 0.14158 |
| Decile 2 | 0.115628 |
| Decile 1 | 0.0865085 |
| Minimum | 7.9755e-09 |
|
|
- Mean = 0.229859
- Std.dev = 0.134882
- 1057 items above graph maximum of 0.753271
|
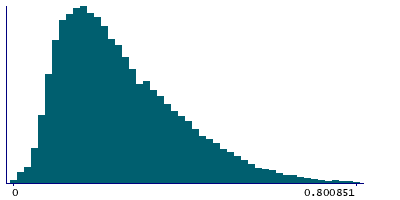
Instance 1 : First repeat assessment visit (2012-13)
19,877 participants, 19,877 items
| Maximum | 1.1057 |
| Decile 9 | 0.45273 |
| Decile 8 | 0.367054 |
| Decile 7 | 0.309115 |
| Decile 6 | 0.26134 |
| Median | 0.222733 |
| Decile 4 | 0.189845 |
| Decile 3 | 0.15997 |
| Decile 2 | 0.12957 |
| Decile 1 | 0.0973535 |
| Minimum | 1.9013e-07 |
|
|
- Mean = 0.25271
- Std.dev = 0.141574
- 25 items above graph maximum of 0.808106
|


