Data
507,960 items of data are available, covering 488,512 participants.
Defined-instances run from 0 to 1, labelled using Instancing
2.
Units of measurement are mmol/l.
| Maximum | 1.7316 |
| Decile 9 | 0.54238 |
| Decile 8 | 0.433098 |
| Decile 7 | 0.360089 |
| Decile 6 | 0.3042 |
| Median | 0.25865 |
| Decile 4 | 0.219875 |
| Decile 3 | 0.18531 |
| Decile 2 | 0.15209 |
| Decile 1 | 0.114609 |
| Minimum | 1.4053e-08 |
|
|
- Mean = 0.298489
- Std.dev = 0.173573
- 1179 items above graph maximum of 0.970151
|
2 Instances
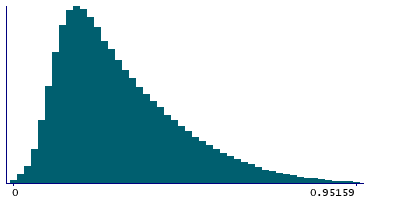
Instance 0 : Initial assessment visit (2006-2010) at which participants were recruited and consent given
488,083 participants, 488,083 items
| Maximum | 1.7316 |
| Decile 9 | 0.54056 |
| Decile 8 | 0.431383 |
| Decile 7 | 0.35861 |
| Decile 6 | 0.302904 |
| Median | 0.257531 |
| Decile 4 | 0.21888 |
| Decile 3 | 0.18451 |
| Decile 2 | 0.151527 |
| Decile 1 | 0.11415 |
| Minimum | 1.4053e-08 |
|

|
- Mean = 0.297352
- Std.dev = 0.173117
- 1145 items above graph maximum of 0.96697
|
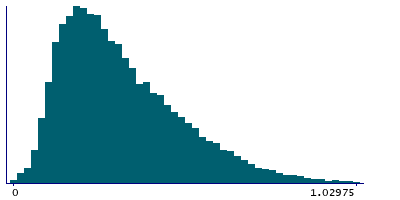
Instance 1 : First repeat assessment visit (2012-13)
19,877 participants, 19,877 items
| Maximum | 1.4159 |
| Decile 9 | 0.58378 |
| Decile 8 | 0.47244 |
| Decile 7 | 0.397567 |
| Decile 6 | 0.337195 |
| Median | 0.287528 |
| Decile 4 | 0.245495 |
| Decile 3 | 0.20664 |
| Decile 2 | 0.16903 |
| Decile 1 | 0.126925 |
| Minimum | 7.1831e-06 |
|
|
- Mean = 0.326407
- Std.dev = 0.182212
- 29 items above graph maximum of 1.04063
|


