Data
507,960 items of data are available, covering 488,512 participants.
Defined-instances run from 0 to 1, labelled using Instancing
2.
Units of measurement are mmol/l.
| Maximum | 0.117426 |
| Decile 9 | 0.032582 |
| Decile 8 | 0.0279104 |
| Decile 7 | 0.025245 |
| Decile 6 | 0.023348 |
| Median | 0.0217913 |
| Decile 4 | 0.020353 |
| Decile 3 | 0.018904 |
| Decile 2 | 0.017251 |
| Decile 1 | 0.0149602 |
| Minimum | 1.2485e-07 |
|
|
- Mean = 0.0229738
- Std.dev = 0.00755654
- 3147 items above graph maximum of 0.0502038
|
2 Instances
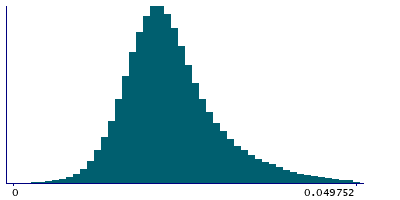
Instance 0 : Initial assessment visit (2006-2010) at which participants were recruited and consent given
488,083 participants, 488,083 items
| Maximum | 0.117426 |
| Decile 9 | 0.0324752 |
| Decile 8 | 0.027841 |
| Decile 7 | 0.025191 |
| Decile 6 | 0.023307 |
| Median | 0.02176 |
| Decile 4 | 0.020331 |
| Decile 3 | 0.018886 |
| Decile 2 | 0.0172377 |
| Decile 1 | 0.0149529 |
| Minimum | 1.2485e-07 |
|

|
- Mean = 0.0229294
- Std.dev = 0.00752239
- 3059 items above graph maximum of 0.0499976
|
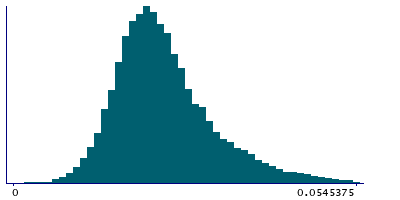
Instance 1 : First repeat assessment visit (2012-13)
19,877 participants, 19,877 items
| Maximum | 0.077552 |
| Decile 9 | 0.0351078 |
| Decile 8 | 0.029827 |
| Decile 7 | 0.0266725 |
| Decile 6 | 0.024491 |
| Median | 0.022664 |
| Decile 4 | 0.021041 |
| Decile 3 | 0.019399 |
| Decile 2 | 0.0175976 |
| Decile 1 | 0.0151655 |
| Minimum | 2.6416e-06 |
|
|
- Mean = 0.0240642
- Std.dev = 0.00827706
- 83 items above graph maximum of 0.0550502
|


