Data
507,960 items of data are available, covering 488,512 participants.
Defined-instances run from 0 to 1, labelled using Instancing
2.
Units of measurement are mmol/l.
| Maximum | 0.46516 |
| Decile 9 | 0.129266 |
| Decile 8 | 0.105744 |
| Decile 7 | 0.0914167 |
| Decile 6 | 0.0811757 |
| Median | 0.073281 |
| Decile 4 | 0.066463 |
| Decile 3 | 0.059992 |
| Decile 2 | 0.053069 |
| Decile 1 | 0.043995 |
| Minimum | 1.4523e-07 |
|
|
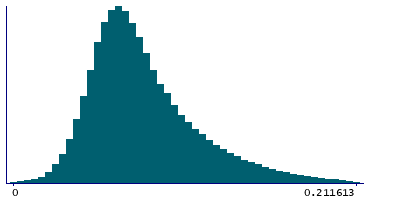
- Mean = 0.0809548
- Std.dev = 0.0359554
- 2617 items above graph maximum of 0.214537
|
2 Instances
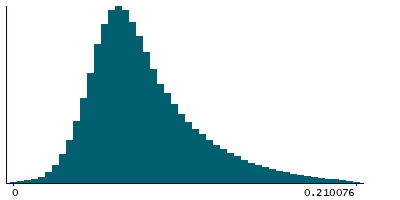
Instance 0 : Initial assessment visit (2006-2010) at which participants were recruited and consent given
488,083 participants, 488,083 items
| Maximum | 0.46516 |
| Decile 9 | 0.12874 |
| Decile 8 | 0.10536 |
| Decile 7 | 0.0911 |
| Decile 6 | 0.080934 |
| Median | 0.073074 |
| Decile 4 | 0.0663158 |
| Decile 3 | 0.0598725 |
| Decile 2 | 0.052986 |
| Decile 1 | 0.0439231 |
| Minimum | 1.4523e-07 |
|
|
- Mean = 0.0807146
- Std.dev = 0.0358029
- 2552 items above graph maximum of 0.213557
|
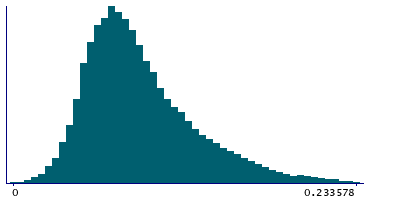
Instance 1 : First repeat assessment visit (2012-13)
19,877 participants, 19,877 items
| Maximum | 0.31482 |
| Decile 9 | 0.14065 |
| Decile 8 | 0.115342 |
| Decile 7 | 0.0994 |
| Decile 6 | 0.0878525 |
| Median | 0.078743 |
| Decile 4 | 0.070794 |
| Decile 3 | 0.0633806 |
| Decile 2 | 0.0555155 |
| Decile 1 | 0.0457865 |
| Minimum | 1.3721e-05 |
|
|
- Mean = 0.0868535
- Std.dev = 0.039055
- 68 items above graph maximum of 0.235513
|


