Data
507,960 items of data are available, covering 488,512 participants.
Defined-instances run from 0 to 1, labelled using Instancing
2.
Units of measurement are mmol/l.
| Maximum | 0.584267 |
| Decile 9 | 0.243305 |
| Decile 8 | 0.220852 |
| Decile 7 | 0.20529 |
| Decile 6 | 0.192657 |
| Median | 0.181153 |
| Decile 4 | 0.17004 |
| Decile 3 | 0.1585 |
| Decile 2 | 0.145514 |
| Decile 1 | 0.128628 |
| Minimum | 4.04324e-14 |
|
|
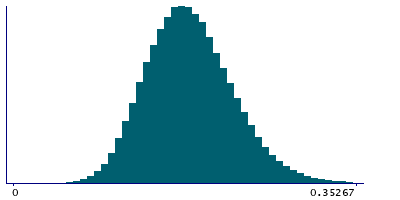
- Mean = 0.184128
- Std.dev = 0.0453564
- 501 items above graph maximum of 0.357982
|
2 Instances
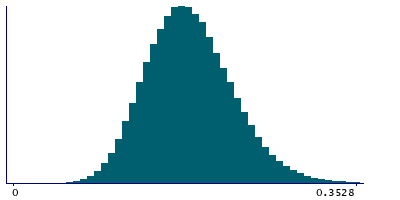
Instance 0 : Initial assessment visit (2006-2010) at which participants were recruited and consent given
488,083 participants, 488,083 items
| Maximum | 0.584267 |
| Decile 9 | 0.243491 |
| Decile 8 | 0.22101 |
| Decile 7 | 0.20543 |
| Decile 6 | 0.192774 |
| Median | 0.181279 |
| Decile 4 | 0.17016 |
| Decile 3 | 0.15862 |
| Decile 2 | 0.145642 |
| Decile 1 | 0.128746 |
| Minimum | 4.04324e-14 |
|
|
- Mean = 0.184266
- Std.dev = 0.0453829
- 476 items above graph maximum of 0.358236
|
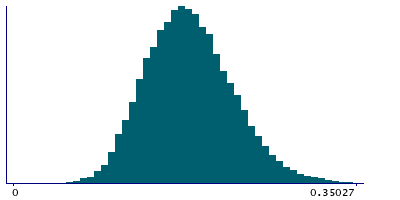
Instance 1 : First repeat assessment visit (2012-13)
19,877 participants, 19,877 items
| Maximum | 0.42284 |
| Decile 9 | 0.23849 |
| Decile 8 | 0.217192 |
| Decile 7 | 0.201885 |
| Decile 6 | 0.18942 |
| Median | 0.17809 |
| Decile 4 | 0.167112 |
| Decile 3 | 0.15539 |
| Decile 2 | 0.142385 |
| Decile 1 | 0.125793 |
| Minimum | 0.033088 |
|
|
- Mean = 0.180738
- Std.dev = 0.044565
- 25 items above graph maximum of 0.351187
|


