Data
507,960 items of data are available, covering 488,512 participants.
Defined-instances run from 0 to 1, labelled using Instancing
2.
Units of measurement are mmol/l.
| Maximum | 0.453133 |
| Decile 9 | 0.16465 |
| Decile 8 | 0.148706 |
| Decile 7 | 0.137794 |
| Decile 6 | 0.128692 |
| Median | 0.12044 |
| Decile 4 | 0.112361 |
| Decile 3 | 0.10391 |
| Decile 2 | 0.094279 |
| Decile 1 | 0.081279 |
| Minimum | 1.81266e-14 |
|

|
- Mean = 0.122008
- Std.dev = 0.0330474
- 494 items above graph maximum of 0.248021
|
2 Instances
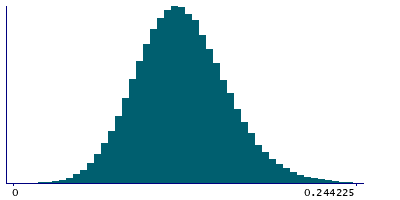
Instance 0 : Initial assessment visit (2006-2010) at which participants were recruited and consent given
488,083 participants, 488,083 items
| Maximum | 0.453133 |
| Decile 9 | 0.164765 |
| Decile 8 | 0.14882 |
| Decile 7 | 0.13791 |
| Decile 6 | 0.128809 |
| Median | 0.120547 |
| Decile 4 | 0.11247 |
| Decile 3 | 0.10402 |
| Decile 2 | 0.0944042 |
| Decile 1 | 0.0813777 |
| Minimum | 1.81266e-14 |
|
|
- Mean = 0.122115
- Std.dev = 0.0330477
- 464 items above graph maximum of 0.248152
|
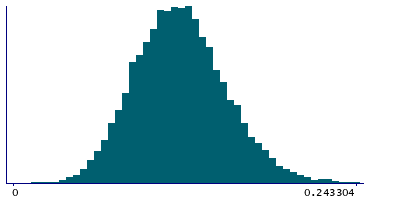
Instance 1 : First repeat assessment visit (2012-13)
19,877 participants, 19,877 items
| Maximum | 0.327457 |
| Decile 9 | 0.1617 |
| Decile 8 | 0.14581 |
| Decile 7 | 0.134759 |
| Decile 6 | 0.125889 |
| Median | 0.11779 |
| Decile 4 | 0.109794 |
| Decile 3 | 0.10132 |
| Decile 2 | 0.091334 |
| Decile 1 | 0.0789038 |
| Minimum | 0.0014111 |
|
|
- Mean = 0.119361
- Std.dev = 0.0329301
- 28 items above graph maximum of 0.244496
|


