Data
507,960 items of data are available, covering 488,512 participants.
Defined-instances run from 0 to 1, labelled using Instancing
2.
Units of measurement are mmol/l.
| Maximum | 2.0425 |
| Decile 9 | 0.85645 |
| Decile 8 | 0.77229 |
| Decile 7 | 0.71415 |
| Decile 6 | 0.666696 |
| Median | 0.624016 |
| Decile 4 | 0.58248 |
| Decile 3 | 0.539731 |
| Decile 2 | 0.491411 |
| Decile 1 | 0.428561 |
| Minimum | 0.0265365 |
|
|
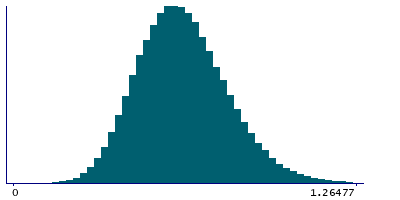
- Mean = 0.635335
- Std.dev = 0.169373
- 512 items above graph maximum of 1.28434
|
2 Instances
Instance 0 : Initial assessment visit (2006-2010) at which participants were recruited and consent given
488,083 participants, 488,083 items
| Maximum | 2.0425 |
| Decile 9 | 0.857242 |
| Decile 8 | 0.772954 |
| Decile 7 | 0.714707 |
| Decile 6 | 0.6673 |
| Median | 0.62456 |
| Decile 4 | 0.582995 |
| Decile 3 | 0.540185 |
| Decile 2 | 0.491915 |
| Decile 1 | 0.428989 |
| Minimum | 0.0265365 |
|
|
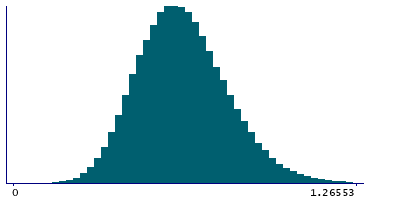
- Mean = 0.635879
- Std.dev = 0.169481
- 491 items above graph maximum of 1.2855
|
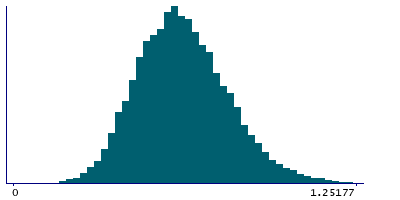
Instance 1 : First repeat assessment visit (2012-13)
19,877 participants, 19,877 items
| Maximum | 1.5487 |
| Decile 9 | 0.83541 |
| Decile 8 | 0.757075 |
| Decile 7 | 0.70069 |
| Decile 6 | 0.653357 |
| Median | 0.611175 |
| Decile 4 | 0.571035 |
| Decile 3 | 0.52801 |
| Decile 2 | 0.47953 |
| Decile 1 | 0.41849 |
| Minimum | 0.11032 |
|
|
- Mean = 0.621963
- Std.dev = 0.166131
- 27 items above graph maximum of 1.25233
|


