Data
507,960 items of data are available, covering 488,512 participants.
Defined-instances run from 0 to 1, labelled using Instancing
2.
Units of measurement are mmol/l.
| Maximum | 0.563186 |
| Decile 9 | 0.134005 |
| Decile 8 | 0.118205 |
| Decile 7 | 0.10854 |
| Decile 6 | 0.1013 |
| Median | 0.095152 |
| Decile 4 | 0.089572 |
| Decile 3 | 0.08414 |
| Decile 2 | 0.0783882 |
| Decile 1 | 0.071193 |
| Minimum | 0.004238 |
|

|
- Mean = 0.0997288
- Std.dev = 0.0266327
- 2946 items above graph maximum of 0.196816
|
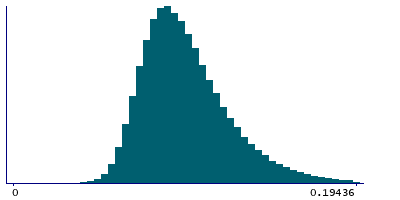
2 Instances
Instance 0 : Initial assessment visit (2006-2010) at which participants were recruited and consent given
488,083 participants, 488,083 items
| Maximum | 0.563186 |
| Decile 9 | 0.1342 |
| Decile 8 | 0.11834 |
| Decile 7 | 0.108638 |
| Decile 6 | 0.101348 |
| Median | 0.095174 |
| Decile 4 | 0.089565 |
| Decile 3 | 0.084123 |
| Decile 2 | 0.0783564 |
| Decile 1 | 0.0711561 |
| Minimum | 0.004238 |
|
|
- Mean = 0.099789
- Std.dev = 0.0267451
- 2842 items above graph maximum of 0.197244
|
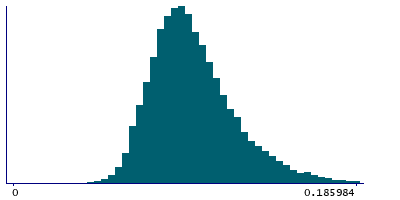
Instance 1 : First repeat assessment visit (2012-13)
19,877 participants, 19,877 items
| Maximum | 0.38966 |
| Decile 9 | 0.1291 |
| Decile 8 | 0.11506 |
| Decile 7 | 0.1065 |
| Decile 6 | 0.10016 |
| Median | 0.0946871 |
| Decile 4 | 0.0897405 |
| Decile 3 | 0.084593 |
| Decile 2 | 0.0791624 |
| Decile 1 | 0.072112 |
| Minimum | 0.036442 |
|
|
- Mean = 0.0982504
- Std.dev = 0.0236576
- 82 items above graph maximum of 0.186088
|


