Data
507,960 items of data are available, covering 488,512 participants.
Defined-instances run from 0 to 1, labelled using Instancing
2.
Units of measurement are mmol/l.
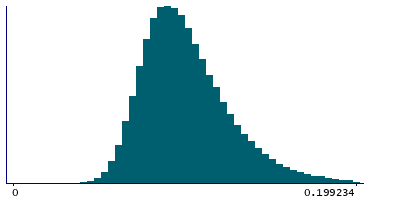
| Maximum | 0.571953 |
| Decile 9 | 0.1371 |
| Decile 8 | 0.12126 |
| Decile 7 | 0.111432 |
| Decile 6 | 0.10396 |
| Median | 0.0976639 |
| Decile 4 | 0.091838 |
| Decile 3 | 0.08613 |
| Decile 2 | 0.080059 |
| Decile 1 | 0.072445 |
| Minimum | 0.0095088 |
|
|
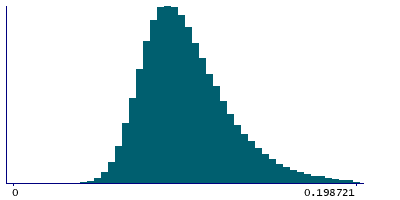
- Mean = 0.102049
- Std.dev = 0.027256
- 2782 items above graph maximum of 0.201755
|
2 Instances
Instance 0 : Initial assessment visit (2006-2010) at which participants were recruited and consent given
488,083 participants, 488,083 items
| Maximum | 0.571953 |
| Decile 9 | 0.137293 |
| Decile 8 | 0.12139 |
| Decile 7 | 0.11151 |
| Decile 6 | 0.104006 |
| Median | 0.097674 |
| Decile 4 | 0.0918257 |
| Decile 3 | 0.086099 |
| Decile 2 | 0.0800199 |
| Decile 1 | 0.072389 |
| Minimum | 0.0095088 |
|
|
- Mean = 0.102096
- Std.dev = 0.0273699
- 2684 items above graph maximum of 0.202197
|
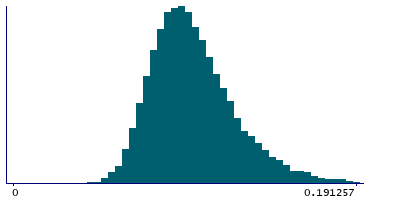
Instance 1 : First repeat assessment visit (2012-13)
19,877 participants, 19,877 items
| Maximum | 0.400818 |
| Decile 9 | 0.13272 |
| Decile 8 | 0.118475 |
| Decile 7 | 0.10976 |
| Decile 6 | 0.103075 |
| Median | 0.0974695 |
| Decile 4 | 0.09218 |
| Decile 3 | 0.086771 |
| Decile 2 | 0.081101 |
| Decile 1 | 0.0738 |
| Minimum | 0.035428 |
|
|
- Mean = 0.100874
- Std.dev = 0.0242628
- 72 items above graph maximum of 0.19164
|


