Data
507,960 items of data are available, covering 488,512 participants.
Defined-instances run from 0 to 1, labelled using Instancing
2.
Units of measurement are mmol/l.
| Maximum | 0.763156 |
| Decile 9 | 0.294781 |
| Decile 8 | 0.26777 |
| Decile 7 | 0.249036 |
| Decile 6 | 0.23343 |
| Median | 0.21914 |
| Decile 4 | 0.20508 |
| Decile 3 | 0.19013 |
| Decile 2 | 0.17303 |
| Decile 1 | 0.14964 |
| Minimum | 0.0319017 |
|
|
- Mean = 0.221327
- Std.dev = 0.0571396
- 471 items above graph maximum of 0.439922
|
2 Instances
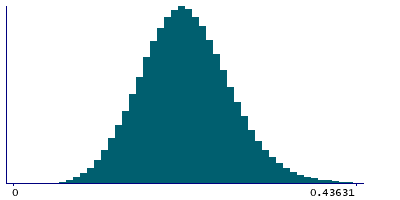
Instance 0 : Initial assessment visit (2006-2010) at which participants were recruited and consent given
488,083 participants, 488,083 items
| Maximum | 0.763156 |
| Decile 9 | 0.29471 |
| Decile 8 | 0.2677 |
| Decile 7 | 0.249 |
| Decile 6 | 0.23341 |
| Median | 0.21915 |
| Decile 4 | 0.20514 |
| Decile 3 | 0.190227 |
| Decile 2 | 0.173167 |
| Decile 1 | 0.14987 |
| Minimum | 0.0319017 |
|
|
- Mean = 0.22136
- Std.dev = 0.0570431
- 451 items above graph maximum of 0.43955
|
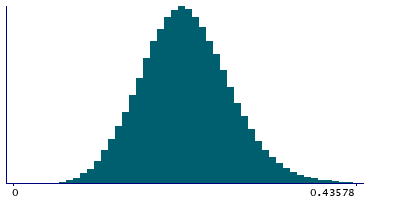
Instance 1 : First repeat assessment visit (2012-13)
19,877 participants, 19,877 items
| Maximum | 0.529973 |
| Decile 9 | 0.296607 |
| Decile 8 | 0.26957 |
| Decile 7 | 0.24993 |
| Decile 6 | 0.234015 |
| Median | 0.21872 |
| Decile 4 | 0.20349 |
| Decile 3 | 0.187735 |
| Decile 2 | 0.1696 |
| Decile 1 | 0.144754 |
| Minimum | 0.0532664 |
|

|
- Mean = 0.220516
- Std.dev = 0.0594559
- 23 items above graph maximum of 0.44846
|


