Data
507,960 items of data are available, covering 488,512 participants.
Defined-instances run from 0 to 1, labelled using Instancing
2.
Units of measurement are mmol/l.
| Maximum | 2.22832 |
| Decile 9 | 0.83455 |
| Decile 8 | 0.75865 |
| Decile 7 | 0.70585 |
| Decile 6 | 0.662184 |
| Median | 0.62162 |
| Decile 4 | 0.581703 |
| Decile 3 | 0.53918 |
| Decile 2 | 0.48965 |
| Decile 1 | 0.4223 |
| Minimum | 0.036255 |
|

|
- Mean = 0.626905
- Std.dev = 0.16222
- 469 items above graph maximum of 1.2468
|
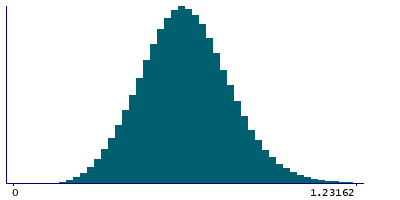
2 Instances
Instance 0 : Initial assessment visit (2006-2010) at which participants were recruited and consent given
488,083 participants, 488,083 items
| Maximum | 2.22832 |
| Decile 9 | 0.834787 |
| Decile 8 | 0.758889 |
| Decile 7 | 0.70608 |
| Decile 6 | 0.66237 |
| Median | 0.62192 |
| Decile 4 | 0.58212 |
| Decile 3 | 0.53968 |
| Decile 2 | 0.49028 |
| Decile 1 | 0.423107 |
| Minimum | 0.036255 |
|
|
- Mean = 0.627301
- Std.dev = 0.162016
- 444 items above graph maximum of 1.24647
|
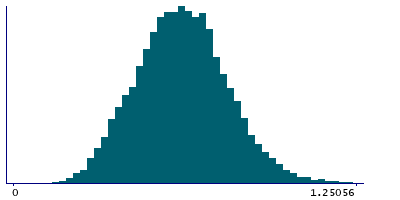
Instance 1 : First repeat assessment visit (2012-13)
19,877 participants, 19,877 items
| Maximum | 1.50982 |
| Decile 9 | 0.82874 |
| Decile 8 | 0.752075 |
| Decile 7 | 0.700435 |
| Decile 6 | 0.65765 |
| Median | 0.614445 |
| Decile 4 | 0.570315 |
| Decile 3 | 0.526795 |
| Decile 2 | 0.474531 |
| Decile 1 | 0.40214 |
| Minimum | 0.119723 |
|
|
- Mean = 0.617177
- Std.dev = 0.166855
- 26 items above graph maximum of 1.25534
|


