Data
507,960 items of data are available, covering 488,512 participants.
Defined-instances run from 0 to 1, labelled using Instancing
2.
Units of measurement are mmol/l.
| Maximum | 4.08879 |
| Decile 9 | 1.62404 |
| Decile 8 | 1.48346 |
| Decile 7 | 1.3867 |
| Decile 6 | 1.3065 |
| Median | 1.23318 |
| Decile 4 | 1.16101 |
| Decile 3 | 1.0841 |
| Decile 2 | 0.997599 |
| Decile 1 | 0.87847 |
| Minimum | 0.17556 |
|

|
- Mean = 1.24595
- Std.dev = 0.294244
- 551 items above graph maximum of 2.36961
|
2 Instances
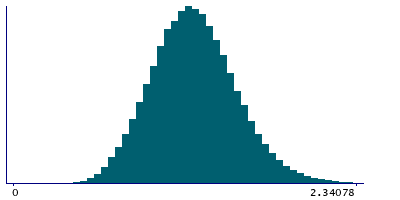
Instance 0 : Initial assessment visit (2006-2010) at which participants were recruited and consent given
488,083 participants, 488,083 items
| Maximum | 4.08879 |
| Decile 9 | 1.62429 |
| Decile 8 | 1.48362 |
| Decile 7 | 1.38695 |
| Decile 6 | 1.3067 |
| Median | 1.2336 |
| Decile 4 | 1.1617 |
| Decile 3 | 1.08482 |
| Decile 2 | 0.998407 |
| Decile 1 | 0.879945 |
| Minimum | 0.17556 |
|
|
- Mean = 1.24653
- Std.dev = 0.293854
- 532 items above graph maximum of 2.36863
|
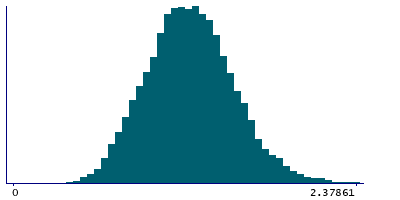
Instance 1 : First repeat assessment visit (2012-13)
19,877 participants, 19,877 items
| Maximum | 2.85043 |
| Decile 9 | 1.61775 |
| Decile 8 | 1.47795 |
| Decile 7 | 1.38125 |
| Decile 6 | 1.30039 |
| Median | 1.2228 |
| Decile 4 | 1.144 |
| Decile 3 | 1.0652 |
| Decile 2 | 0.972665 |
| Decile 1 | 0.843555 |
| Minimum | 0.316085 |
|
|
- Mean = 1.23167
- Std.dev = 0.303325
- 24 items above graph maximum of 2.39195
|


