Data
507,960 items of data are available, covering 488,512 participants.
Defined-instances run from 0 to 1, labelled using Instancing
2.
Units of measurement are mmol/l.
| Maximum | 0.218066 |
| Decile 9 | 0.0778249 |
| Decile 8 | 0.069937 |
| Decile 7 | 0.064631 |
| Decile 6 | 0.060387 |
| Median | 0.05659 |
| Decile 4 | 0.052989 |
| Decile 3 | 0.049314 |
| Decile 2 | 0.045262 |
| Decile 1 | 0.040054 |
| Minimum | 0.009738 |
|
|
- Mean = 0.0580615
- Std.dev = 0.0151018
- 994 items above graph maximum of 0.115596
|
2 Instances
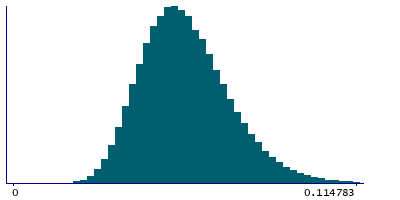
Instance 0 : Initial assessment visit (2006-2010) at which participants were recruited and consent given
488,083 participants, 488,083 items
| Maximum | 0.218066 |
| Decile 9 | 0.0778191 |
| Decile 8 | 0.0699351 |
| Decile 7 | 0.0646277 |
| Decile 6 | 0.0603855 |
| Median | 0.05659 |
| Decile 4 | 0.0529895 |
| Decile 3 | 0.049317 |
| Decile 2 | 0.045272 |
| Decile 1 | 0.0400728 |
| Minimum | 0.009738 |
|

|
- Mean = 0.0580673
- Std.dev = 0.0151064
- 973 items above graph maximum of 0.115565
|
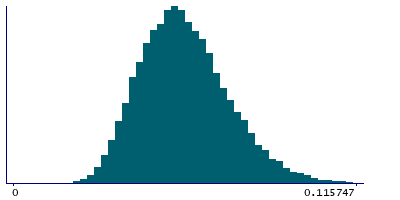
Instance 1 : First repeat assessment visit (2012-13)
19,877 participants, 19,877 items
| Maximum | 0.195351 |
| Decile 9 | 0.077988 |
| Decile 8 | 0.0700045 |
| Decile 7 | 0.064704 |
| Decile 6 | 0.060441 |
| Median | 0.056618 |
| Decile 4 | 0.0529675 |
| Decile 3 | 0.0492045 |
| Decile 2 | 0.0450325 |
| Decile 1 | 0.0396695 |
| Minimum | 0.016704 |
|
|
- Mean = 0.0579196
- Std.dev = 0.0149895
- 20 items above graph maximum of 0.116307
|


