Data
507,960 items of data are available, covering 488,512 participants.
Defined-instances run from 0 to 1, labelled using Instancing
2.
Units of measurement are mmol/l.
| Maximum | 1.3287 |
| Decile 9 | 0.47994 |
| Decile 8 | 0.43276 |
| Decile 7 | 0.40106 |
| Decile 6 | 0.37553 |
| Median | 0.352884 |
| Decile 4 | 0.331388 |
| Decile 3 | 0.30948 |
| Decile 2 | 0.28541 |
| Decile 1 | 0.25426 |
| Minimum | 0.071259 |
|
|
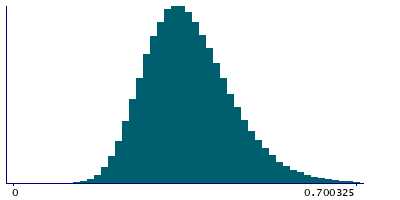
- Mean = 0.361814
- Std.dev = 0.090448
- 1046 items above graph maximum of 0.70562
|
2 Instances
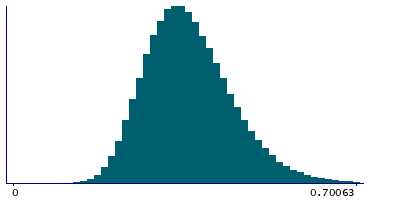
Instance 0 : Initial assessment visit (2006-2010) at which participants were recruited and consent given
488,083 participants, 488,083 items
| Maximum | 1.3287 |
| Decile 9 | 0.480124 |
| Decile 8 | 0.432869 |
| Decile 7 | 0.401138 |
| Decile 6 | 0.375593 |
| Median | 0.35294 |
| Decile 4 | 0.33144 |
| Decile 3 | 0.309546 |
| Decile 2 | 0.28549 |
| Decile 1 | 0.25433 |
| Minimum | 0.071259 |
|
|
- Mean = 0.361915
- Std.dev = 0.0905195
- 1023 items above graph maximum of 0.705918
|
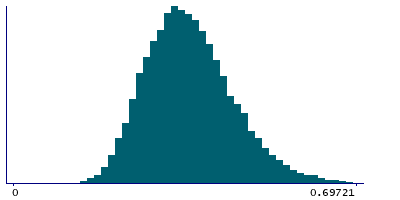
Instance 1 : First repeat assessment visit (2012-13)
19,877 participants, 19,877 items
| Maximum | 1.21012 |
| Decile 9 | 0.476185 |
| Decile 8 | 0.430485 |
| Decile 7 | 0.399236 |
| Decile 6 | 0.374315 |
| Median | 0.35164 |
| Decile 4 | 0.329655 |
| Decile 3 | 0.307979 |
| Decile 2 | 0.28339 |
| Decile 1 | 0.251955 |
| Minimum | 0.11112 |
|
|
- Mean = 0.359326
- Std.dev = 0.088637
- 22 items above graph maximum of 0.700415
|


