Data
507,960 items of data are available, covering 488,512 participants.
Defined-instances run from 0 to 1, labelled using Instancing
2.
Units of measurement are mmol/l.
| Maximum | 0.336699 |
| Decile 9 | 0.120671 |
| Decile 8 | 0.105081 |
| Decile 7 | 0.094454 |
| Decile 6 | 0.085759 |
| Median | 0.0779718 |
| Decile 4 | 0.070616 |
| Decile 3 | 0.063029 |
| Decile 2 | 0.054839 |
| Decile 1 | 0.0445238 |
| Minimum | 8.34451e-05 |
|
|
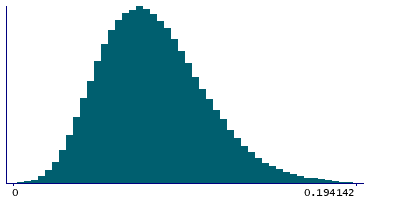
- Mean = 0.0808182
- Std.dev = 0.0300964
- 641 items above graph maximum of 0.196818
|
2 Instances
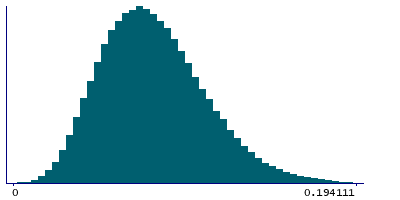
Instance 0 : Initial assessment visit (2006-2010) at which participants were recruited and consent given
488,083 participants, 488,083 items
| Maximum | 0.336699 |
| Decile 9 | 0.120739 |
| Decile 8 | 0.10514 |
| Decile 7 | 0.0945105 |
| Decile 6 | 0.0858106 |
| Median | 0.0780191 |
| Decile 4 | 0.0706624 |
| Decile 3 | 0.063074 |
| Decile 2 | 0.0548811 |
| Decile 1 | 0.0445683 |
| Minimum | 8.34451e-05 |
|
|
- Mean = 0.0808747
- Std.dev = 0.0301127
- 614 items above graph maximum of 0.19691
|
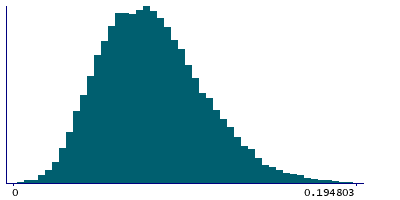
Instance 1 : First repeat assessment visit (2012-13)
19,877 participants, 19,877 items
| Maximum | 0.247254 |
| Decile 9 | 0.119064 |
| Decile 8 | 0.10357 |
| Decile 7 | 0.0930215 |
| Decile 6 | 0.0844205 |
| Median | 0.076734 |
| Decile 4 | 0.0693063 |
| Decile 3 | 0.061826 |
| Decile 2 | 0.053687 |
| Decile 1 | 0.0434308 |
| Minimum | 0.0051194 |
|
|
- Mean = 0.0794297
- Std.dev = 0.0296614
- 23 items above graph maximum of 0.194697
|


