Data
507,960 items of data are available, covering 488,512 participants.
Defined-instances run from 0 to 1, labelled using Instancing
2.
Units of measurement are mmol/l.
| Maximum | 0.528697 |
| Decile 9 | 0.196826 |
| Decile 8 | 0.171439 |
| Decile 7 | 0.154079 |
| Decile 6 | 0.139894 |
| Median | 0.12734 |
| Decile 4 | 0.115317 |
| Decile 3 | 0.10302 |
| Decile 2 | 0.089648 |
| Decile 1 | 0.0729207 |
| Minimum | 2.5243e-08 |
|

|
- Mean = 0.131932
- Std.dev = 0.0489583
- 626 items above graph maximum of 0.320731
|
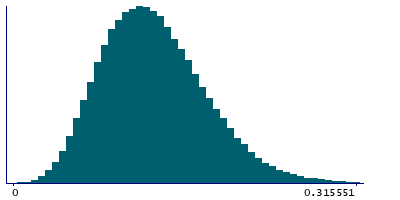
2 Instances
Instance 0 : Initial assessment visit (2006-2010) at which participants were recruited and consent given
488,083 participants, 488,083 items
| Maximum | 0.528697 |
| Decile 9 | 0.196961 |
| Decile 8 | 0.171575 |
| Decile 7 | 0.15423 |
| Decile 6 | 0.14001 |
| Median | 0.12745 |
| Decile 4 | 0.11541 |
| Decile 3 | 0.1031 |
| Decile 2 | 0.089715 |
| Decile 1 | 0.0729915 |
| Minimum | 2.5243e-08 |
|
|
- Mean = 0.132046
- Std.dev = 0.0490063
- 609 items above graph maximum of 0.32093
|
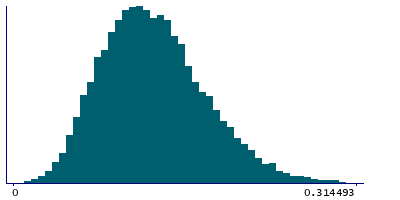
Instance 1 : First repeat assessment visit (2012-13)
19,877 participants, 19,877 items
| Maximum | 0.408442 |
| Decile 9 | 0.192779 |
| Decile 8 | 0.167555 |
| Decile 7 | 0.150752 |
| Decile 6 | 0.137165 |
| Median | 0.124945 |
| Decile 4 | 0.11289 |
| Decile 3 | 0.101236 |
| Decile 2 | 0.0880666 |
| Decile 1 | 0.0712575 |
| Minimum | 0.010909 |
|
|
- Mean = 0.129117
- Std.dev = 0.0476767
- 24 items above graph maximum of 0.3143
|
Notes
Phospholipids in Medium VLDL from Nightingale Health data. Biomarker group: Lipoprotein subclasses, Biomarker subgroup: Medium VLDL (average diameter 44.5 nm)
1 Related Data-Field
| Field ID | Description | Relationship |
|---|
| 23804 | Phospholipids in Medium VLDL, QC Flag | Field 23804 is the QC flag for Current Field |
Problem running reference query
0 Resources
There are no matching Resources
