Data
507,960 items of data are available, covering 488,512 participants.
Defined-instances run from 0 to 1, labelled using Instancing
2.
Units of measurement are mmol/l.
| Maximum | 2.52277 |
| Decile 9 | 0.883179 |
| Decile 8 | 0.76818 |
| Decile 7 | 0.689684 |
| Decile 6 | 0.62587 |
| Median | 0.569677 |
| Decile 4 | 0.516313 |
| Decile 3 | 0.46275 |
| Decile 2 | 0.40501 |
| Decile 1 | 0.334523 |
| Minimum | 0.022893 |
|
|
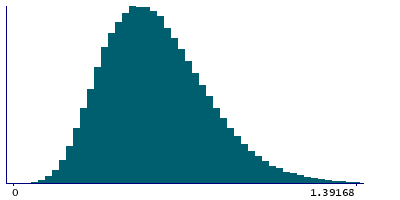
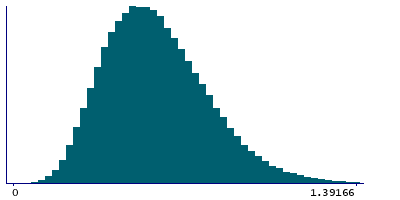
- Mean = 0.593394
- Std.dev = 0.217352
- 764 items above graph maximum of 1.43183
|
2 Instances
Instance 0 : Initial assessment visit (2006-2010) at which participants were recruited and consent given
488,083 participants, 488,083 items
| Maximum | 2.52277 |
| Decile 9 | 0.884093 |
| Decile 8 | 0.769052 |
| Decile 7 | 0.690471 |
| Decile 6 | 0.626407 |
| Median | 0.57009 |
| Decile 4 | 0.516603 |
| Decile 3 | 0.4629 |
| Decile 2 | 0.40519 |
| Decile 1 | 0.3346 |
| Minimum | 0.022893 |
|
|
- Mean = 0.593887
- Std.dev = 0.217704
- 740 items above graph maximum of 1.43359
|
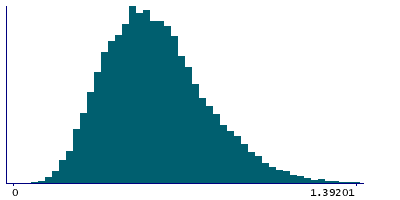
Instance 1 : First repeat assessment visit (2012-13)
19,877 participants, 19,877 items
| Maximum | 1.8931 |
| Decile 9 | 0.861971 |
| Decile 8 | 0.745885 |
| Decile 7 | 0.671047 |
| Decile 6 | 0.613636 |
| Median | 0.559795 |
| Decile 4 | 0.50905 |
| Decile 3 | 0.45851 |
| Decile 2 | 0.40098 |
| Decile 1 | 0.332525 |
| Minimum | 0.082197 |
|
|
- Mean = 0.581295
- Std.dev = 0.208162
- 24 items above graph maximum of 1.39142
|


