Data
507,960 items of data are available, covering 488,512 participants.
Defined-instances run from 0 to 1, labelled using Instancing
2.
Units of measurement are mmol/l.
| Maximum | 1.40299 |
| Decile 9 | 0.31288 |
| Decile 8 | 0.252944 |
| Decile 7 | 0.21323 |
| Decile 6 | 0.181254 |
| Median | 0.15404 |
| Decile 4 | 0.1296 |
| Decile 3 | 0.107401 |
| Decile 2 | 0.086256 |
| Decile 1 | 0.06428 |
| Minimum | 8.5772e-09 |
|

|
- Mean = 0.174739
- Std.dev = 0.102206
- 1960 items above graph maximum of 0.56148
|
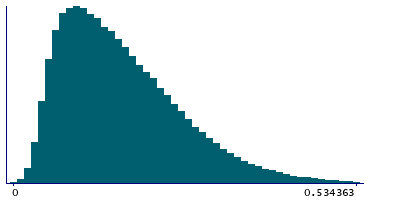
2 Instances
Instance 0 : Initial assessment visit (2006-2010) at which participants were recruited and consent given
488,083 participants, 488,083 items
| Maximum | 1.40299 |
| Decile 9 | 0.313311 |
| Decile 8 | 0.253352 |
| Decile 7 | 0.213522 |
| Decile 6 | 0.18146 |
| Median | 0.15416 |
| Decile 4 | 0.129659 |
| Decile 3 | 0.10736 |
| Decile 2 | 0.0861943 |
| Decile 1 | 0.0642091 |
| Minimum | 8.5772e-09 |
|
|
- Mean = 0.174919
- Std.dev = 0.102434
- 1883 items above graph maximum of 0.562413
|
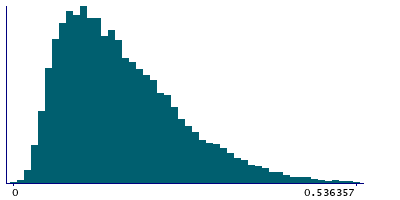
Instance 1 : First repeat assessment visit (2012-13)
19,877 participants, 19,877 items
| Maximum | 1.0825 |
| Decile 9 | 0.3004 |
| Decile 8 | 0.24242 |
| Decile 7 | 0.206555 |
| Decile 6 | 0.176461 |
| Median | 0.15158 |
| Decile 4 | 0.12855 |
| Decile 3 | 0.10813 |
| Decile 2 | 0.087736 |
| Decile 1 | 0.0658519 |
| Minimum | 4.177e-07 |
|
|
- Mean = 0.170338
- Std.dev = 0.0963473
- 79 items above graph maximum of 0.534948
|


