Data
507,960 items of data are available, covering 488,512 participants.
Defined-instances run from 0 to 1, labelled using Instancing
2.
Units of measurement are mmol/l.
| Maximum | 0.309696 |
| Decile 9 | 0.0834513 |
| Decile 8 | 0.069202 |
| Decile 7 | 0.059449 |
| Decile 6 | 0.051416 |
| Median | 0.0443116 |
| Decile 4 | 0.03771 |
| Decile 3 | 0.0313403 |
| Decile 2 | 0.024784 |
| Decile 1 | 0.0172976 |
| Minimum | 2.87391e-05 |
|

|
- Mean = 0.0480195
- Std.dev = 0.0263343
- 1022 items above graph maximum of 0.149605
|
2 Instances
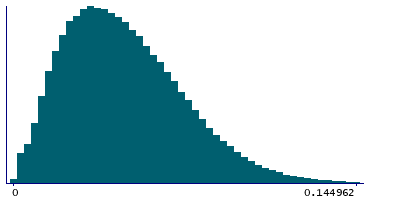
Instance 0 : Initial assessment visit (2006-2010) at which participants were recruited and consent given
488,083 participants, 488,083 items
| Maximum | 0.309696 |
| Decile 9 | 0.0835962 |
| Decile 8 | 0.0693343 |
| Decile 7 | 0.0595569 |
| Decile 6 | 0.0514969 |
| Median | 0.0443768 |
| Decile 4 | 0.037749 |
| Decile 3 | 0.031353 |
| Decile 2 | 0.0247861 |
| Decile 1 | 0.017289 |
| Minimum | 2.87391e-05 |
|
|
- Mean = 0.0480877
- Std.dev = 0.0263974
- 982 items above graph maximum of 0.149903
|
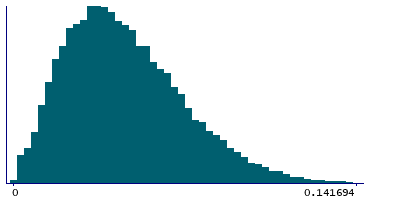
Instance 1 : First repeat assessment visit (2012-13)
19,877 participants, 19,877 items
| Maximum | 0.23212 |
| Decile 9 | 0.0795888 |
| Decile 8 | 0.0659005 |
| Decile 7 | 0.056868 |
| Decile 6 | 0.049506 |
| Median | 0.0429831 |
| Decile 4 | 0.0368406 |
| Decile 3 | 0.030977 |
| Decile 2 | 0.024725 |
| Decile 1 | 0.017548 |
| Minimum | 0.000713792 |
|
|
- Mean = 0.0463443
- Std.dev = 0.0246776
- 39 items above graph maximum of 0.14163
|


