Data
507,960 items of data are available, covering 488,512 participants.
Defined-instances run from 0 to 1, labelled using Instancing
2.
Units of measurement are mmol/l.
| Maximum | 0.265182 |
| Decile 9 | 0.084784 |
| Decile 8 | 0.072449 |
| Decile 7 | 0.063888 |
| Decile 6 | 0.056794 |
| Median | 0.050385 |
| Decile 4 | 0.044265 |
| Decile 3 | 0.038054 |
| Decile 2 | 0.031271 |
| Decile 1 | 0.022927 |
| Minimum | 1.73342e-05 |
|

|
- Mean = 0.052604
- Std.dev = 0.0243233
- 639 items above graph maximum of 0.146641
|
2 Instances
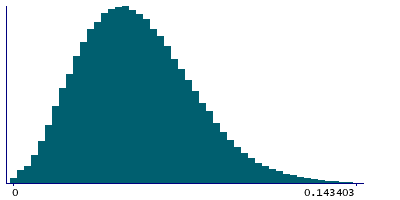
Instance 0 : Initial assessment visit (2006-2010) at which participants were recruited and consent given
488,083 participants, 488,083 items
| Maximum | 0.265182 |
| Decile 9 | 0.084881 |
| Decile 8 | 0.072549 |
| Decile 7 | 0.063969 |
| Decile 6 | 0.0568669 |
| Median | 0.0504345 |
| Decile 4 | 0.0443049 |
| Decile 3 | 0.0380734 |
| Decile 2 | 0.0312861 |
| Decile 1 | 0.0229214 |
| Minimum | 1.73342e-05 |
|
|
- Mean = 0.0526573
- Std.dev = 0.024364
- 616 items above graph maximum of 0.146841
|
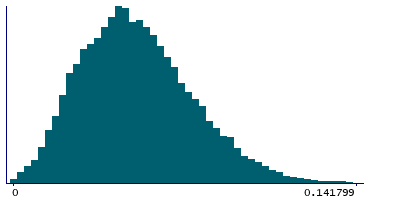
Instance 1 : First repeat assessment visit (2012-13)
19,877 participants, 19,877 items
| Maximum | 0.19611 |
| Decile 9 | 0.082379 |
| Decile 8 | 0.0700478 |
| Decile 7 | 0.0618545 |
| Decile 6 | 0.055129 |
| Median | 0.0492205 |
| Decile 4 | 0.0434355 |
| Decile 3 | 0.0376006 |
| Decile 2 | 0.0309181 |
| Decile 1 | 0.02305 |
| Minimum | 0.00070204 |
|
|
- Mean = 0.0512964
- Std.dev = 0.0232628
- 22 items above graph maximum of 0.141708
|


