Data
507,960 items of data are available, covering 488,512 participants.
Defined-instances run from 0 to 1, labelled using Instancing
2.
Units of measurement are mmol/l.
| Maximum | 1.25405 |
| Decile 9 | 0.233733 |
| Decile 8 | 0.18037 |
| Decile 7 | 0.14559 |
| Decile 6 | 0.118344 |
| Median | 0.095568 |
| Decile 4 | 0.0756226 |
| Decile 3 | 0.0578217 |
| Decile 2 | 0.041187 |
| Decile 1 | 0.02403 |
| Minimum | 3.946e-09 |
|

|
- Mean = 0.115655
- Std.dev = 0.0876828
- 2561 items above graph maximum of 0.443435
|
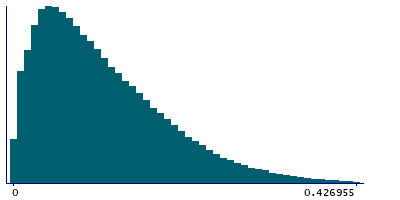
2 Instances
Instance 0 : Initial assessment visit (2006-2010) at which participants were recruited and consent given
488,083 participants, 488,083 items
| Maximum | 1.25405 |
| Decile 9 | 0.234187 |
| Decile 8 | 0.18078 |
| Decile 7 | 0.14584 |
| Decile 6 | 0.11849 |
| Median | 0.0956707 |
| Decile 4 | 0.075642 |
| Decile 3 | 0.05781 |
| Decile 2 | 0.0411339 |
| Decile 1 | 0.0239706 |
| Minimum | 3.946e-09 |
|
|
- Mean = 0.115829
- Std.dev = 0.087919
- 2468 items above graph maximum of 0.444403
|
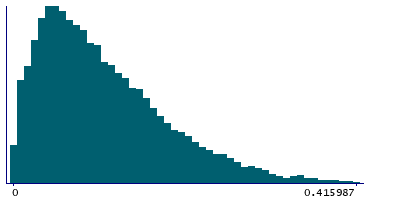
Instance 1 : First repeat assessment visit (2012-13)
19,877 participants, 19,877 items
| Maximum | 0.93702 |
| Decile 9 | 0.22077 |
| Decile 8 | 0.170593 |
| Decile 7 | 0.13976 |
| Decile 6 | 0.114621 |
| Median | 0.093401 |
| Decile 4 | 0.0750685 |
| Decile 3 | 0.058052 |
| Decile 2 | 0.042276 |
| Decile 1 | 0.0255665 |
| Minimum | 3.8418e-08 |
|
|
- Mean = 0.111389
- Std.dev = 0.0815546
- 105 items above graph maximum of 0.415974
|


