Data
507,960 items of data are available, covering 488,512 participants.
Defined-instances run from 0 to 1, labelled using Instancing
2.
Units of measurement are mmol/l.
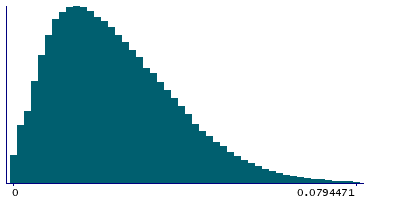
| Maximum | 0.199594 |
| Decile 9 | 0.0443638 |
| Decile 8 | 0.035945 |
| Decile 7 | 0.030179 |
| Decile 6 | 0.025571 |
| Median | 0.0215341 |
| Decile 4 | 0.01787 |
| Decile 3 | 0.0144159 |
| Decile 2 | 0.010974 |
| Decile 1 | 0.00712279 |
| Minimum | 2.3349e-08 |
|
|
- Mean = 0.0240888
- Std.dev = 0.0150242
- 1442 items above graph maximum of 0.0816048
|
2 Instances
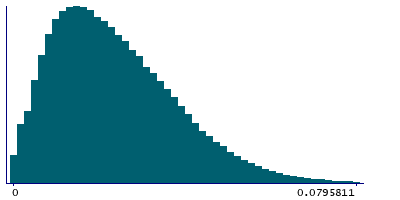
Instance 0 : Initial assessment visit (2006-2010) at which participants were recruited and consent given
488,083 participants, 488,083 items
| Maximum | 0.199594 |
| Decile 9 | 0.0444502 |
| Decile 8 | 0.0360151 |
| Decile 7 | 0.030234 |
| Decile 6 | 0.025613 |
| Median | 0.0215604 |
| Decile 4 | 0.0178813 |
| Decile 3 | 0.014419 |
| Decile 2 | 0.0109686 |
| Decile 1 | 0.0071148 |
| Minimum | 2.3349e-08 |
|
|
- Mean = 0.0241238
- Std.dev = 0.0150638
- 1384 items above graph maximum of 0.0817857
|
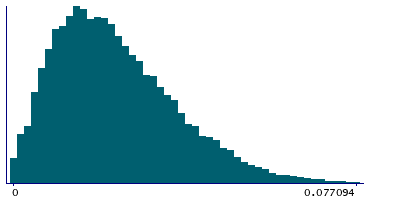
Instance 1 : First repeat assessment visit (2012-13)
19,877 participants, 19,877 items
| Maximum | 0.13697 |
| Decile 9 | 0.0422009 |
| Decile 8 | 0.0341155 |
| Decile 7 | 0.028802 |
| Decile 6 | 0.02457 |
| Median | 0.0209665 |
| Decile 4 | 0.0176275 |
| Decile 3 | 0.0143303 |
| Decile 2 | 0.011132 |
| Decile 1 | 0.00739675 |
| Minimum | 8.5509e-06 |
|
|
- Mean = 0.0232302
- Std.dev = 0.0139879
- 51 items above graph maximum of 0.0770051
|


