Data
507,960 items of data are available, covering 488,512 participants.
Defined-instances run from 0 to 1, labelled using Instancing
2.
Units of measurement are mmol/l.
| Maximum | 0.353324 |
| Decile 9 | 0.0947956 |
| Decile 8 | 0.0788938 |
| Decile 7 | 0.067914 |
| Decile 6 | 0.0589407 |
| Median | 0.050961 |
| Decile 4 | 0.0435564 |
| Decile 3 | 0.0362719 |
| Decile 2 | 0.028727 |
| Decile 1 | 0.0197899 |
| Minimum | 5.47613e-06 |
|

|
- Mean = 0.0548454
- Std.dev = 0.029751
- 916 items above graph maximum of 0.169801
|
2 Instances
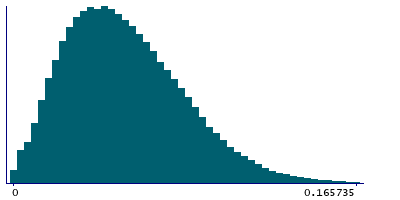
Instance 0 : Initial assessment visit (2006-2010) at which participants were recruited and consent given
488,083 participants, 488,083 items
| Maximum | 0.353324 |
| Decile 9 | 0.0949744 |
| Decile 8 | 0.0790752 |
| Decile 7 | 0.0680555 |
| Decile 6 | 0.059047 |
| Median | 0.0510384 |
| Decile 4 | 0.043609 |
| Decile 3 | 0.0362976 |
| Decile 2 | 0.0287506 |
| Decile 1 | 0.019783 |
| Minimum | 5.47613e-06 |
|
|
- Mean = 0.0549347
- Std.dev = 0.0298242
- 872 items above graph maximum of 0.170166
|
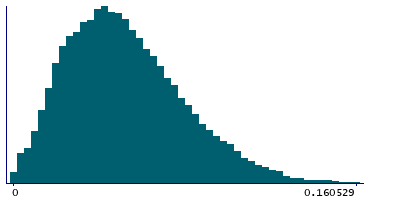
Instance 1 : First repeat assessment visit (2012-13)
19,877 participants, 19,877 items
| Maximum | 0.23279 |
| Decile 9 | 0.0901575 |
| Decile 8 | 0.0748545 |
| Decile 7 | 0.0646185 |
| Decile 6 | 0.05638 |
| Median | 0.0491565 |
| Decile 4 | 0.0424196 |
| Decile 3 | 0.035552 |
| Decile 2 | 0.0282724 |
| Decile 1 | 0.0199305 |
| Minimum | 0.000223442 |
|
|
- Mean = 0.0526522
- Std.dev = 0.027804
- 32 items above graph maximum of 0.160384
|


