Data
507,960 items of data are available, covering 488,512 participants.
Defined-instances run from 0 to 1, labelled using Instancing
2.
Units of measurement are mmol/l.
| Maximum | 1.95959 |
| Decile 9 | 0.40236 |
| Decile 8 | 0.31912 |
| Decile 7 | 0.26337 |
| Decile 6 | 0.21936 |
| Median | 0.18159 |
| Decile 4 | 0.148031 |
| Decile 3 | 0.117086 |
| Decile 2 | 0.0871255 |
| Decile 1 | 0.054433 |
| Minimum | 4.02503e-05 |
|

|
- Mean = 0.209973
- Std.dev = 0.14255
- 1982 items above graph maximum of 0.750287
|
2 Instances
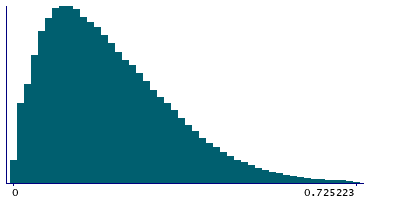
Instance 0 : Initial assessment visit (2006-2010) at which participants were recruited and consent given
488,083 participants, 488,083 items
| Maximum | 1.95959 |
| Decile 9 | 0.40313 |
| Decile 8 | 0.31988 |
| Decile 7 | 0.263805 |
| Decile 6 | 0.21969 |
| Median | 0.181849 |
| Decile 4 | 0.14816 |
| Decile 3 | 0.11711 |
| Decile 2 | 0.087059 |
| Decile 1 | 0.0543433 |
| Minimum | 4.02503e-05 |
|
|
- Mean = 0.2103
- Std.dev = 0.142935
- 1901 items above graph maximum of 0.751917
|
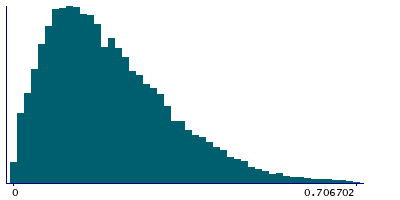
Instance 1 : First repeat assessment visit (2012-13)
19,877 participants, 19,877 items
| Maximum | 1.4292 |
| Decile 9 | 0.380881 |
| Decile 8 | 0.301705 |
| Decile 7 | 0.25188 |
| Decile 6 | 0.21166 |
| Median | 0.175841 |
| Decile 4 | 0.145425 |
| Decile 3 | 0.11653 |
| Decile 2 | 0.08848 |
| Decile 1 | 0.0568848 |
| Minimum | 0.000405843 |
|
|
- Mean = 0.201941
- Std.dev = 0.132495
- 74 items above graph maximum of 0.704877
|


