Data
507,960 items of data are available, covering 488,512 participants.
Defined-instances run from 0 to 1, labelled using Instancing
2.
Units of measurement are mmol/l.
| Maximum | 0.549349 |
| Decile 9 | 0.0789876 |
| Decile 8 | 0.05827 |
| Decile 7 | 0.044863 |
| Decile 6 | 0.034653 |
| Median | 0.026462 |
| Decile 4 | 0.019651 |
| Decile 3 | 0.013694 |
| Decile 2 | 0.0080817 |
| Decile 1 | 0.00205339 |
| Minimum | 1.13577e-07 |
|
|
- Mean = 0.0351433
- Std.dev = 0.0324878
- 3083 items above graph maximum of 0.155922
|
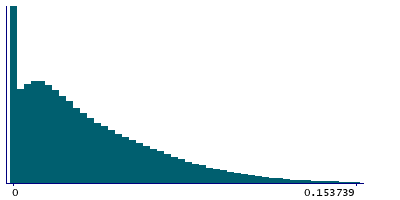
2 Instances
Instance 0 : Initial assessment visit (2006-2010) at which participants were recruited and consent given
488,083 participants, 488,083 items
| Maximum | 0.549349 |
| Decile 9 | 0.0792235 |
| Decile 8 | 0.0584496 |
| Decile 7 | 0.044971 |
| Decile 6 | 0.034723 |
| Median | 0.026494 |
| Decile 4 | 0.0196629 |
| Decile 3 | 0.013683 |
| Decile 2 | 0.00806346 |
| Decile 1 | 0.0020298 |
| Minimum | 1.13577e-07 |
|

|
- Mean = 0.0352212
- Std.dev = 0.0325963
- 2960 items above graph maximum of 0.156417
|
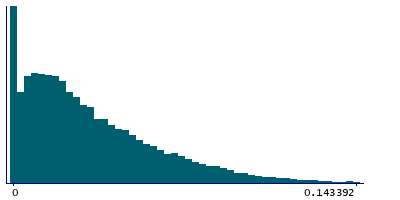
Instance 1 : First repeat assessment visit (2012-13)
19,877 participants, 19,877 items
| Maximum | 0.339925 |
| Decile 9 | 0.073097 |
| Decile 8 | 0.0543635 |
| Decile 7 | 0.042337 |
| Decile 6 | 0.0329955 |
| Median | 0.0256365 |
| Decile 4 | 0.0194105 |
| Decile 3 | 0.013957 |
| Decile 2 | 0.00849415 |
| Decile 1 | 0.0026845 |
| Minimum | 2.4708e-07 |
|
|
- Mean = 0.0332296
- Std.dev = 0.0296344
- 120 items above graph maximum of 0.14351
|


