Data
507,962 items of data are available, covering 488,514 participants.
Defined-instances run from 0 to 1, labelled using Instancing
2.
Units of measurement are mmol/l.
| Maximum | 2.10195 |
| Decile 9 | 0.97933 |
| Decile 8 | 0.917041 |
| Decile 7 | 0.875474 |
| Decile 6 | 0.84143 |
| Median | 0.810893 |
| Decile 4 | 0.78163 |
| Decile 3 | 0.75136 |
| Decile 2 | 0.71757 |
| Decile 1 | 0.67348 |
| Minimum | 0.27476 |
|
|
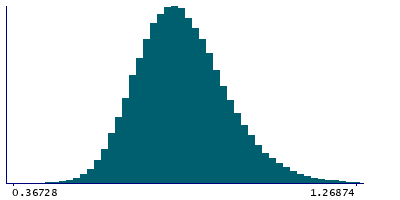
- Mean = 0.820559
- Std.dev = 0.122756
- 9 items below graph minimum of 0.36763
- 991 items above graph maximum of 1.28518
|
2 Instances
Instance 0 : Initial assessment visit (2006-2010) at which participants were recruited and consent given
488,085 participants, 488,085 items
| Maximum | 2.10195 |
| Decile 9 | 0.979701 |
| Decile 8 | 0.91736 |
| Decile 7 | 0.87569 |
| Decile 6 | 0.84156 |
| Median | 0.811029 |
| Decile 4 | 0.78168 |
| Decile 3 | 0.7513 |
| Decile 2 | 0.71742 |
| Decile 1 | 0.673253 |
| Minimum | 0.27476 |
|
|
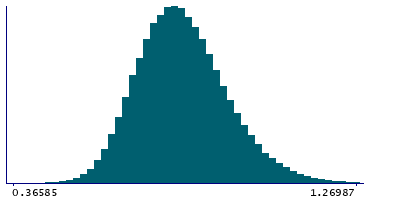
- Mean = 0.820625
- Std.dev = 0.122937
- 9 items below graph minimum of 0.366805
- 944 items above graph maximum of 1.28615
|
Instance 1 : First repeat assessment visit (2012-13)
19,877 participants, 19,877 items
| Maximum | 1.85637 |
| Decile 9 | 0.968792 |
| Decile 8 | 0.90931 |
| Decile 7 | 0.87076 |
| Decile 6 | 0.838805 |
| Median | 0.808055 |
| Decile 4 | 0.78001 |
| Decile 3 | 0.75273 |
| Decile 2 | 0.72154 |
| Decile 1 | 0.67937 |
| Minimum | 0.37902 |
|
|
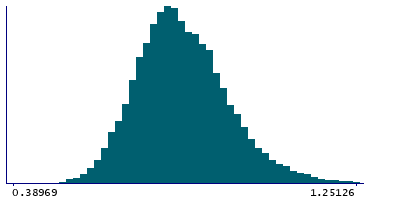
- Mean = 0.818955
- Std.dev = 0.118199
- 1 item below graph minimum of 0.389948
- 45 items above graph maximum of 1.25821
|


