Data
507,892 items of data are available, covering 488,455 participants.
Defined-instances run from 0 to 1, labelled using Instancing
2.
Units of measurement are g/l.
| Maximum | 80.0048 |
| Decile 9 | 43.825 |
| Decile 8 | 42.375 |
| Decile 7 | 41.365 |
| Decile 6 | 40.512 |
| Median | 39.7194 |
| Decile 4 | 38.923 |
| Decile 3 | 38.072 |
| Decile 2 | 37.052 |
| Decile 1 | 35.5853 |
| Minimum | 0 |
|
|
- Mean = 39.7236
- Std.dev = 3.46133
- 864 items below graph minimum of 27.3455
- 1648 items above graph maximum of 52.0647
|
2 Instances
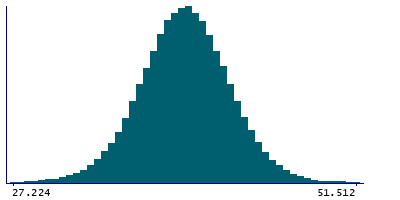
Instance 0 : Initial assessment visit (2006-2010) at which participants were recruited and consent given
488,020 participants, 488,020 items
| Maximum | 80.0048 |
| Decile 9 | 43.8092 |
| Decile 8 | 42.36 |
| Decile 7 | 41.352 |
| Decile 6 | 40.5 |
| Median | 39.7057 |
| Decile 4 | 38.9104 |
| Decile 3 | 38.061 |
| Decile 2 | 37.042 |
| Decile 1 | 35.577 |
| Minimum | 0 |
|

|
- Mean = 39.7095
- Std.dev = 3.45458
- 838 items below graph minimum of 27.3448
- 1542 items above graph maximum of 52.0413
|
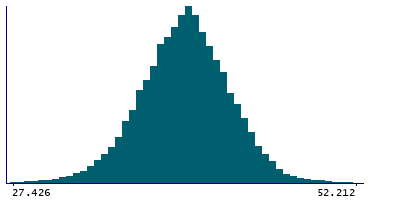
Instance 1 : First repeat assessment visit (2012-13)
19,872 participants, 19,872 items
| Maximum | 78.5452 |
| Decile 9 | 44.186 |
| Decile 8 | 42.7214 |
| Decile 7 | 41.6849 |
| Decile 6 | 40.819 |
| Median | 40.043 |
| Decile 4 | 39.255 |
| Decile 3 | 38.3774 |
| Decile 2 | 37.3294 |
| Decile 1 | 35.843 |
| Minimum | 22.369 |
|
|
- Mean = 40.0694
- Std.dev = 3.60591
- 29 items below graph minimum of 27.5
- 108 items above graph maximum of 52.529
|


