Data
507,958 items of data are available, covering 488,510 participants.
Defined-instances run from 0 to 1, labelled using Instancing
2.
Units of measurement are mmol/l.
| Maximum | 0.42117 |
| Decile 9 | 0.0199235 |
| Decile 8 | 0.0166932 |
| Decile 7 | 0.0150158 |
| Decile 6 | 0.013885 |
| Median | 0.012999 |
| Decile 4 | 0.012238 |
| Decile 3 | 0.0115203 |
| Decile 2 | 0.0107818 |
| Decile 1 | 0.00986866 |
| Minimum | 0.0023285 |
|

|
- Mean = 0.0143193
- Std.dev = 0.00567667
- 9698 items above graph maximum of 0.0299784
|
2 Instances
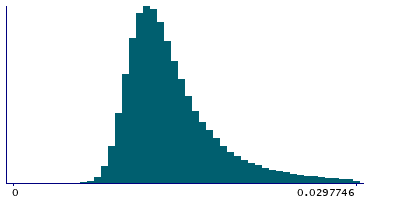
Instance 0 : Initial assessment visit (2006-2010) at which participants were recruited and consent given
488,081 participants, 488,081 items
| Maximum | 0.42117 |
| Decile 9 | 0.0199743 |
| Decile 8 | 0.0167325 |
| Decile 7 | 0.01505 |
| Decile 6 | 0.013915 |
| Median | 0.013025 |
| Decile 4 | 0.01226 |
| Decile 3 | 0.01154 |
| Decile 2 | 0.010797 |
| Decile 1 | 0.0098803 |
| Minimum | 0.0023285 |
|
|
- Mean = 0.0143478
- Std.dev = 0.00569717
- 9295 items above graph maximum of 0.0300684
|
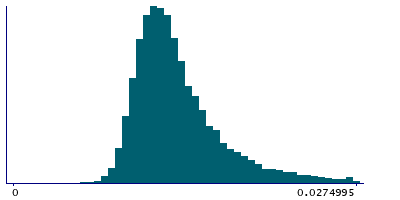
Instance 1 : First repeat assessment visit (2012-13)
19,877 participants, 19,877 items
| Maximum | 0.118922 |
| Decile 9 | 0.0185589 |
| Decile 8 | 0.015696 |
| Decile 7 | 0.014207 |
| Decile 6 | 0.0131833 |
| Median | 0.012427 |
| Decile 4 | 0.0117517 |
| Decile 3 | 0.011108 |
| Decile 2 | 0.010447 |
| Decile 1 | 0.00965338 |
| Minimum | 0.0052931 |
|
|
- Mean = 0.0136196
- Std.dev = 0.00509804
- 406 items above graph maximum of 0.0274645
|


