Data
507,483 items of data are available, covering 488,076 participants.
Defined-instances run from 0 to 1, labelled using Instancing
2.
Units of measurement are mmol/l.
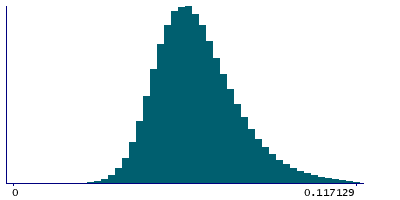
| Maximum | 0.38941 |
| Decile 9 | 0.0827389 |
| Decile 8 | 0.074722 |
| Decile 7 | 0.069588 |
| Decile 6 | 0.0655898 |
| Median | 0.062109 |
| Decile 4 | 0.058848 |
| Decile 3 | 0.055561 |
| Decile 2 | 0.051939 |
| Decile 1 | 0.047297 |
| Minimum | 0.0055112 |
|

|
- Mean = 0.0639128
- Std.dev = 0.0145918
- 1879 items above graph maximum of 0.118181
|
2 Instances
Instance 0 : Initial assessment visit (2006-2010) at which participants were recruited and consent given
487,629 participants, 487,629 items
| Maximum | 0.38941 |
| Decile 9 | 0.082819 |
| Decile 8 | 0.074799 |
| Decile 7 | 0.0696537 |
| Decile 6 | 0.0656506 |
| Median | 0.0621657 |
| Decile 4 | 0.0589001 |
| Decile 3 | 0.055603 |
| Decile 2 | 0.051979 |
| Decile 1 | 0.0473207 |
| Minimum | 0.0055112 |
|
|
- Mean = 0.0639686
- Std.dev = 0.0146121
- 1805 items above graph maximum of 0.118317
|
Instance 1 : First repeat assessment visit (2012-13)
19,854 participants, 19,854 items
| Maximum | 0.17951 |
| Decile 9 | 0.0808037 |
| Decile 8 | 0.0726991 |
| Decile 7 | 0.0678244 |
| Decile 6 | 0.0640555 |
| Median | 0.0608106 |
| Decile 4 | 0.057653 |
| Decile 3 | 0.054484 |
| Decile 2 | 0.05107 |
| Decile 1 | 0.046713 |
| Minimum | 0.019735 |
|

|
- Mean = 0.0625429
- Std.dev = 0.0140134
- 68 items above graph maximum of 0.114894
|


