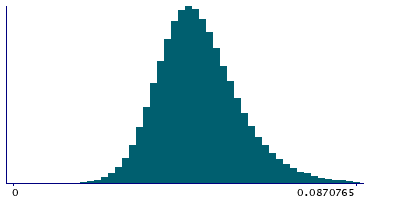
Data
507,640 items of data are available, covering 488,213 participants.
Defined-instances run from 0 to 1, labelled using Instancing
2.
Units of measurement are mmol/l.
| Maximum | 1.3092 |
| Decile 9 | 0.061935 |
| Decile 8 | 0.0561623 |
| Decile 7 | 0.052444 |
| Decile 6 | 0.049525 |
| Median | 0.0469538 |
| Decile 4 | 0.044515 |
| Decile 3 | 0.042006 |
| Decile 2 | 0.039213 |
| Decile 1 | 0.0354705 |
| Minimum | 0.0051803 |
|

|
- Mean = 0.0480986
- Std.dev = 0.0115425
- 1963 items above graph maximum of 0.0883995
|
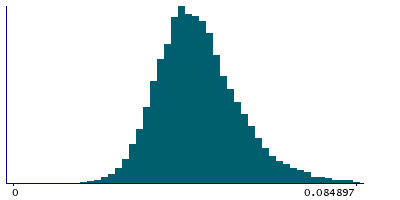
2 Instances
Instance 0 : Initial assessment visit (2006-2010) at which participants were recruited and consent given
487,776 participants, 487,776 items
| Maximum | 1.3092 |
| Decile 9 | 0.06203 |
| Decile 8 | 0.0562521 |
| Decile 7 | 0.0525364 |
| Decile 6 | 0.0496136 |
| Median | 0.047038 |
| Decile 4 | 0.0446007 |
| Decile 3 | 0.0420896 |
| Decile 2 | 0.0392914 |
| Decile 1 | 0.035546 |
| Minimum | 0.0051803 |
|
|
- Mean = 0.048179
- Std.dev = 0.0115118
- 1873 items above graph maximum of 0.088514
|
Instance 1 : First repeat assessment visit (2012-13)
19,864 participants, 19,864 items
| Maximum | 0.5922 |
| Decile 9 | 0.0592876 |
| Decile 8 | 0.0538135 |
| Decile 7 | 0.050064 |
| Decile 6 | 0.0473206 |
| Median | 0.044883 |
| Decile 4 | 0.0424765 |
| Decile 3 | 0.040178 |
| Decile 2 | 0.037485 |
| Decile 1 | 0.034009 |
| Minimum | 0.011916 |
|
|
- Mean = 0.0461226
- Std.dev = 0.0121043
- 114 items above graph maximum of 0.0845661
|


