Data
507,327 items of data are available, covering 487,913 participants.
Defined-instances run from 0 to 1, labelled using Instancing
2.
Units of measurement are percent.
| Maximum | 10.673 |
| Decile 9 | 2.83278 |
| Decile 8 | 2.46855 |
| Decile 7 | 2.2445 |
| Decile 6 | 2.06917 |
| Median | 1.917 |
| Decile 4 | 1.7729 |
| Decile 3 | 1.62596 |
| Decile 2 | 1.45904 |
| Decile 1 | 1.23128 |
| Minimum | 0.00351365 |
|

|
- Mean = 1.99279
- Std.dev = 0.678211
- 2779 items above graph maximum of 4.43427
|
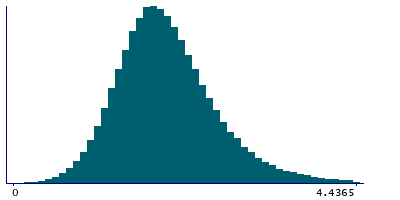
2 Instances
Instance 0 : Initial assessment visit (2006-2010) at which participants were recruited and consent given
487,462 participants, 487,462 items
| Maximum | 10.673 |
| Decile 9 | 2.83363 |
| Decile 8 | 2.4685 |
| Decile 7 | 2.244 |
| Decile 6 | 2.0686 |
| Median | 1.9162 |
| Decile 4 | 1.772 |
| Decile 3 | 1.6249 |
| Decile 2 | 1.458 |
| Decile 1 | 1.23 |
| Minimum | 0.00351365 |
|
|
- Mean = 1.9922
- Std.dev = 0.678958
- 2663 items above graph maximum of 4.43727
|
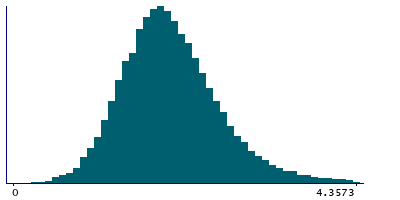
Instance 1 : First repeat assessment visit (2012-13)
19,865 participants, 19,865 items
| Maximum | 7.96237 |
| Decile 9 | 2.8114 |
| Decile 8 | 2.4698 |
| Decile 7 | 2.25635 |
| Decile 6 | 2.0841 |
| Median | 1.93476 |
| Decile 4 | 1.7959 |
| Decile 3 | 1.65165 |
| Decile 2 | 1.4854 |
| Decile 1 | 1.26401 |
| Minimum | 0.057939 |
|
|
- Mean = 2.00726
- Std.dev = 0.659445
- 116 items above graph maximum of 4.35879
|


