Data
507,327 items of data are available, covering 487,913 participants.
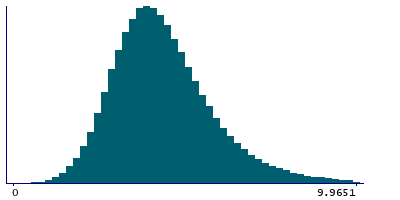
Defined-instances run from 0 to 1, labelled using Instancing
2.
Units of measurement are percent.
| Maximum | 27.1848 |
| Decile 9 | 6.2924 |
| Decile 8 | 5.43779 |
| Decile 7 | 4.9134 |
| Decile 6 | 4.5136 |
| Median | 4.1694 |
| Decile 4 | 3.84707 |
| Decile 3 | 3.5245 |
| Decile 2 | 3.1645 |
| Decile 1 | 2.6926 |
| Minimum | 0.00608147 |
|
|
- Mean = 4.38097
- Std.dev = 1.53905
- 3283 items above graph maximum of 9.8922
|
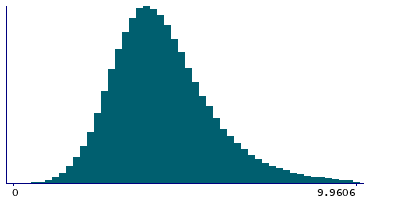
2 Instances
Instance 0 : Initial assessment visit (2006-2010) at which participants were recruited and consent given
487,462 participants, 487,462 items
| Maximum | 27.1848 |
| Decile 9 | 6.2894 |
| Decile 8 | 5.43429 |
| Decile 7 | 4.909 |
| Decile 6 | 4.5093 |
| Median | 4.16591 |
| Decile 4 | 3.8436 |
| Decile 3 | 3.5214 |
| Decile 2 | 3.16216 |
| Decile 1 | 2.6909 |
| Minimum | 0.00608147 |
|
|
- Mean = 4.37816
- Std.dev = 1.53922
- 3169 items above graph maximum of 9.8879
|
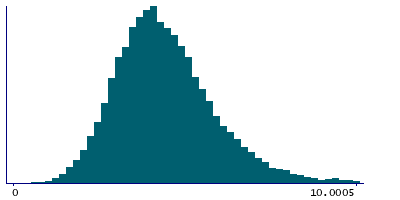
Instance 1 : First repeat assessment visit (2012-13)
19,865 participants, 19,865 items
| Maximum | 19.0831 |
| Decile 9 | 6.36551 |
| Decile 8 | 5.5209 |
| Decile 7 | 5.01232 |
| Decile 6 | 4.6161 |
| Median | 4.25535 |
| Decile 4 | 3.934 |
| Decile 3 | 3.59835 |
| Decile 2 | 3.2235 |
| Decile 1 | 2.7457 |
| Minimum | 0.24998 |
|
|
- Mean = 4.44987
- Std.dev = 1.53327
- 117 items above graph maximum of 9.98531
|


