Data
507,327 items of data are available, covering 487,913 participants.
Defined-instances run from 0 to 1, labelled using Instancing
2.
Units of measurement are mmol/l.
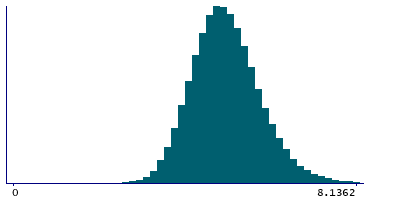
| Maximum | 19.399 |
| Decile 9 | 6.1739 |
| Decile 8 | 5.75858 |
| Decile 7 | 5.48203 |
| Decile 6 | 5.25488 |
| Median | 5.0509 |
| Decile 4 | 4.8529 |
| Decile 3 | 4.6482 |
| Decile 2 | 4.41376 |
| Decile 1 | 4.10103 |
| Minimum | 1.0063 |
|
|
- Mean = 5.1053
- Std.dev = 0.828374
- 805 items above graph maximum of 8.24677
|
2 Instances
Instance 0 : Initial assessment visit (2006-2010) at which participants were recruited and consent given
487,462 participants, 487,462 items
| Maximum | 19.399 |
| Decile 9 | 6.1742 |
| Decile 8 | 5.75851 |
| Decile 7 | 5.4816 |
| Decile 6 | 5.2542 |
| Median | 5.0506 |
| Decile 4 | 4.8527 |
| Decile 3 | 4.6482 |
| Decile 2 | 4.41399 |
| Decile 1 | 4.10185 |
| Minimum | 1.0063 |
|

|
- Mean = 5.10539
- Std.dev = 0.82816
- 769 items above graph maximum of 8.24655
|
Instance 1 : First repeat assessment visit (2012-13)
19,865 participants, 19,865 items
| Maximum | 10.5138 |
| Decile 9 | 6.16295 |
| Decile 8 | 5.75999 |
| Decile 7 | 5.49106 |
| Decile 6 | 5.2699 |
| Median | 5.05946 |
| Decile 4 | 4.85682 |
| Decile 3 | 4.64817 |
| Decile 2 | 4.4087 |
| Decile 1 | 4.07735 |
| Minimum | 1.8733 |
|

|
- Mean = 5.103
- Std.dev = 0.833589
- 35 items above graph maximum of 8.24855
|


