Data
507,327 items of data are available, covering 487,913 participants.
Defined-instances run from 0 to 1, labelled using Instancing
2.
Units of measurement are mmol/l.
| Maximum | 16.411 |
| Decile 9 | 5.4676 |
| Decile 8 | 5.1213 |
| Decile 7 | 4.8865 |
| Decile 6 | 4.696 |
| Median | 4.52266 |
| Decile 4 | 4.35445 |
| Decile 3 | 4.1808 |
| Decile 2 | 3.98035 |
| Decile 1 | 3.7102 |
| Minimum | 1.0053 |
|
|
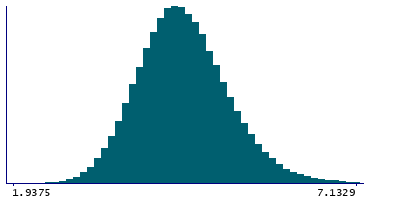
- Mean = 4.56551
- Std.dev = 0.70375
- 8 items below graph minimum of 1.9528
- 852 items above graph maximum of 7.225
|
2 Instances
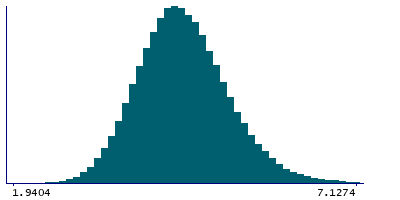
Instance 0 : Initial assessment visit (2006-2010) at which participants were recruited and consent given
487,462 participants, 487,462 items
| Maximum | 16.411 |
| Decile 9 | 5.468 |
| Decile 8 | 5.12153 |
| Decile 7 | 4.88674 |
| Decile 6 | 4.6959 |
| Median | 4.5225 |
| Decile 4 | 4.3546 |
| Decile 3 | 4.1812 |
| Decile 2 | 3.9808 |
| Decile 1 | 3.7117 |
| Minimum | 1.0053 |
|
|
- Mean = 4.56594
- Std.dev = 0.70341
- 7 items below graph minimum of 1.9554
- 812 items above graph maximum of 7.2243
|
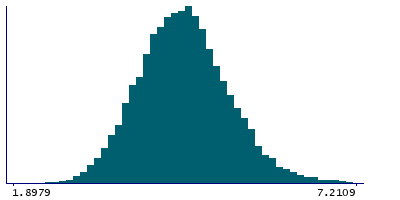
Instance 1 : First repeat assessment visit (2012-13)
19,865 participants, 19,865 items
| Maximum | 9.4304 |
| Decile 9 | 5.4572 |
| Decile 8 | 5.1145 |
| Decile 7 | 4.882 |
| Decile 6 | 4.69871 |
| Median | 4.52709 |
| Decile 4 | 4.3508 |
| Decile 3 | 4.17094 |
| Decile 2 | 3.9667 |
| Decile 1 | 3.67563 |
| Minimum | 1.7986 |
|
|
- Mean = 4.55503
- Std.dev = 0.711968
- 1 item below graph minimum of 1.89406
- 39 items above graph maximum of 7.23877
|


