Data
507,328 items of data are available, covering 487,914 participants.
Defined-instances run from 0 to 1, labelled using Instancing
2.
Units of measurement are mmol/l.
| Maximum | 41.1225 |
| Decile 9 | 15.5033 |
| Decile 8 | 14.1307 |
| Decile 7 | 13.258 |
| Decile 6 | 12.5684 |
| Median | 11.963 |
| Decile 4 | 11.399 |
| Decile 3 | 10.827 |
| Decile 2 | 10.1882 |
| Decile 1 | 9.3617 |
| Minimum | 2.9101 |
|
|
- Mean = 12.2556
- Std.dev = 2.51105
- 1629 items above graph maximum of 21.6449
|
2 Instances
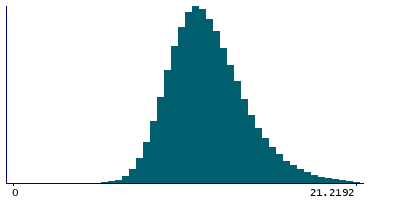
Instance 0 : Initial assessment visit (2006-2010) at which participants were recruited and consent given
487,463 participants, 487,463 items
| Maximum | 41.1225 |
| Decile 9 | 15.513 |
| Decile 8 | 14.135 |
| Decile 7 | 13.259 |
| Decile 6 | 12.567 |
| Median | 11.96 |
| Decile 4 | 11.396 |
| Decile 3 | 10.823 |
| Decile 2 | 10.185 |
| Decile 1 | 9.3587 |
| Minimum | 2.9101 |
|

|
- Mean = 12.2561
- Std.dev = 2.51628
- 1574 items above graph maximum of 21.6673
|
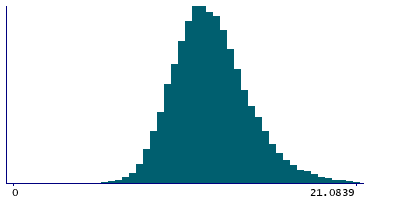
Instance 1 : First repeat assessment visit (2012-13)
19,865 participants, 19,865 items
| Maximum | 28.892 |
| Decile 9 | 15.294 |
| Decile 8 | 14.034 |
| Decile 7 | 13.2395 |
| Decile 6 | 12.607 |
| Median | 12.0382 |
| Decile 4 | 11.487 |
| Decile 3 | 10.929 |
| Decile 2 | 10.276 |
| Decile 1 | 9.43255 |
| Minimum | 5.373 |
|
|
- Mean = 12.2436
- Std.dev = 2.3791
- 53 items above graph maximum of 21.1555
|


