Data
507,328 items of data are available, covering 487,914 participants.
Defined-instances run from 0 to 1, labelled using Instancing
2.
Units of measurement are mmol/l.
| Maximum | 5.6974 |
| Decile 9 | 2.6289 |
| Decile 8 | 2.44422 |
| Decile 7 | 2.31693 |
| Decile 6 | 2.2121 |
| Median | 2.1169 |
| Decile 4 | 2.0238 |
| Decile 3 | 1.926 |
| Decile 2 | 1.81518 |
| Decile 1 | 1.66551 |
| Minimum | 0 |
|
|
- Mean = 2.13659
- Std.dev = 0.384717
- 757 items above graph maximum of 3.59229
|
2 Instances
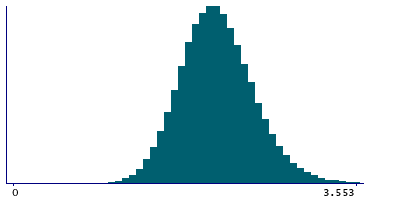
Instance 0 : Initial assessment visit (2006-2010) at which participants were recruited and consent given
487,463 participants, 487,463 items
| Maximum | 5.6974 |
| Decile 9 | 2.6282 |
| Decile 8 | 2.4434 |
| Decile 7 | 2.3162 |
| Decile 6 | 2.2114 |
| Median | 2.1163 |
| Decile 4 | 2.0234 |
| Decile 3 | 1.9257 |
| Decile 2 | 1.8152 |
| Decile 1 | 1.6657 |
| Minimum | 0 |
|

|
- Mean = 2.13617
- Std.dev = 0.384321
- 728 items above graph maximum of 3.5907
|
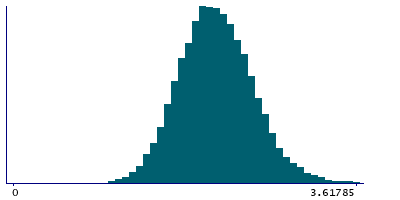
Instance 1 : First repeat assessment visit (2012-13)
19,865 participants, 19,865 items
| Maximum | 4.55441 |
| Decile 9 | 2.64516 |
| Decile 8 | 2.4641 |
| Decile 7 | 2.33726 |
| Decile 6 | 2.2325 |
| Median | 2.1314 |
| Decile 4 | 2.0334 |
| Decile 3 | 1.9336 |
| Decile 2 | 1.8144 |
| Decile 1 | 1.6605 |
| Minimum | 0.7231 |
|
|
- Mean = 2.14674
- Std.dev = 0.394178
- 32 items above graph maximum of 3.62983
|


