Data
507,960 items of data are available, covering 488,512 participants.
Defined-instances run from 0 to 1, labelled using Instancing
2.
Units of measurement are nm.
| Maximum | 25.16 |
| Decile 9 | 24.0367 |
| Decile 8 | 24.0063 |
| Decile 7 | 23.9823 |
| Decile 6 | 23.96 |
| Median | 23.938 |
| Decile 4 | 23.915 |
| Decile 3 | 23.889 |
| Decile 2 | 23.857 |
| Decile 1 | 23.8088 |
| Minimum | 23.033 |
|

|
- Mean = 23.9287
- Std.dev = 0.0906658
- 814 items below graph minimum of 23.5809
- 4 items above graph maximum of 24.2647
|
2 Instances
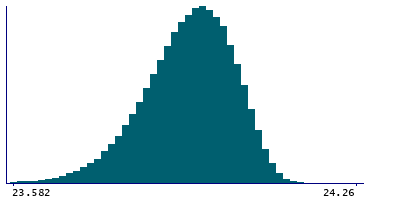
Instance 0 : Initial assessment visit (2006-2010) at which participants were recruited and consent given
488,083 participants, 488,083 items
| Maximum | 25.16 |
| Decile 9 | 24.037 |
| Decile 8 | 24.0066 |
| Decile 7 | 23.9826 |
| Decile 6 | 23.96 |
| Median | 23.9383 |
| Decile 4 | 23.915 |
| Decile 3 | 23.889 |
| Decile 2 | 23.857 |
| Decile 1 | 23.8087 |
| Minimum | 23.033 |
|
|
- Mean = 23.9288
- Std.dev = 0.0907439
- 783 items below graph minimum of 23.5804
- 4 items above graph maximum of 24.2653
|
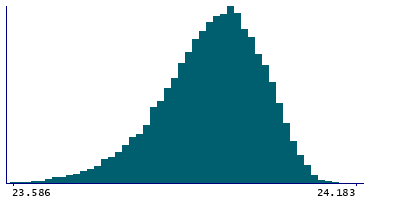
Instance 1 : First repeat assessment visit (2012-13)
19,877 participants, 19,877 items
| Maximum | 24.183 |
| Decile 9 | 24.033 |
| Decile 8 | 24.003 |
| Decile 7 | 23.979 |
| Decile 6 | 23.958 |
| Median | 23.936 |
| Decile 4 | 23.9134 |
| Decile 3 | 23.888 |
| Decile 2 | 23.857 |
| Decile 1 | 23.81 |
| Minimum | 23.429 |
|
|
- Mean = 23.9271
- Std.dev = 0.0887115
- 29 items below graph minimum of 23.587
|


