Data
507,960 items of data are available, covering 488,512 participants.
Defined-instances run from 0 to 1, labelled using Instancing
2.
Units of measurement are mmol/l.
| Maximum | 11.995 |
| Decile 9 | 3.3676 |
| Decile 8 | 2.8659 |
| Decile 7 | 2.52886 |
| Decile 6 | 2.2569 |
| Median | 2.0189 |
| Decile 4 | 1.8011 |
| Decile 3 | 1.5893 |
| Decile 2 | 1.3724 |
| Decile 1 | 1.11941 |
| Minimum | 0.24976 |
|
|
- Mean = 2.157
- Std.dev = 0.904886
- 1368 items above graph maximum of 5.61579
|
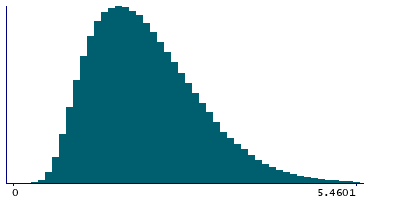
2 Instances
Instance 0 : Initial assessment visit (2006-2010) at which participants were recruited and consent given
488,083 participants, 488,083 items
| Maximum | 11.995 |
| Decile 9 | 3.3725 |
| Decile 8 | 2.87124 |
| Decile 7 | 2.5323 |
| Decile 6 | 2.2591 |
| Median | 2.0206 |
| Decile 4 | 1.8017 |
| Decile 3 | 1.5894 |
| Decile 2 | 1.3723 |
| Decile 1 | 1.11886 |
| Minimum | 0.24976 |
|

|
- Mean = 2.15909
- Std.dev = 0.907297
- 1320 items above graph maximum of 5.62614
|
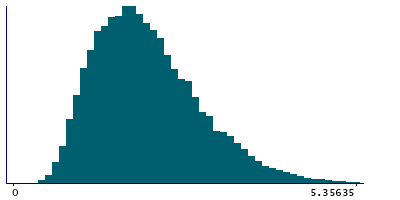
Instance 1 : First repeat assessment visit (2012-13)
19,877 participants, 19,877 items
| Maximum | 8.4942 |
| Decile 9 | 3.244 |
| Decile 8 | 2.7583 |
| Decile 7 | 2.44469 |
| Decile 6 | 2.20245 |
| Median | 1.9825 |
| Decile 4 | 1.7869 |
| Decile 3 | 1.5879 |
| Decile 2 | 1.3766 |
| Decile 1 | 1.13497 |
| Minimum | 0.35048 |
|
|
- Mean = 2.10584
- Std.dev = 0.841891
- 46 items above graph maximum of 5.35303
|


