Data
507,960 items of data are available, covering 488,512 participants.
Defined-instances run from 0 to 1, labelled using Instancing
2.
Units of measurement are mmol/l.
| Maximum | 23.73 |
| Decile 9 | 11.201 |
| Decile 8 | 10.362 |
| Decile 7 | 9.7954 |
| Decile 6 | 9.33 |
| Median | 8.91403 |
| Decile 4 | 8.5074 |
| Decile 3 | 8.0835 |
| Decile 2 | 7.5991 |
| Decile 1 | 6.9496 |
| Minimum | 1.519 |
|

|
- Mean = 9.01638
- Std.dev = 1.69597
- 720 items above graph maximum of 15.4524
|
2 Instances
Instance 0 : Initial assessment visit (2006-2010) at which participants were recruited and consent given
488,083 participants, 488,083 items
| Maximum | 23.73 |
| Decile 9 | 11.2027 |
| Decile 8 | 10.3626 |
| Decile 7 | 9.7951 |
| Decile 6 | 9.3301 |
| Median | 8.91381 |
| Decile 4 | 8.5077 |
| Decile 3 | 8.0842 |
| Decile 2 | 7.60041 |
| Decile 1 | 6.95318 |
| Minimum | 1.519 |
|
|
- Mean = 9.01763
- Std.dev = 1.69552
- 693 items above graph maximum of 15.4521
|
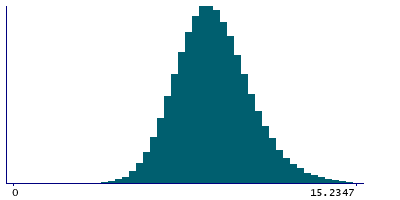
Instance 1 : First repeat assessment visit (2012-13)
19,877 participants, 19,877 items
| Maximum | 19.3304 |
| Decile 9 | 11.175 |
| Decile 8 | 10.3415 |
| Decile 7 | 9.80125 |
| Decile 6 | 9.3277 |
| Median | 8.9202 |
| Decile 4 | 8.49952 |
| Decile 3 | 8.0595 |
| Decile 2 | 7.56175 |
| Decile 1 | 6.85875 |
| Minimum | 3.3804 |
|

|
- Mean = 8.98586
- Std.dev = 1.70674
- 26 items above graph maximum of 15.4913
|


