Data
507,960 items of data are available, covering 488,512 participants.
Defined-instances run from 0 to 1, labelled using Instancing
2.
Units of measurement are mmol/l.
| Maximum | 0.980769 |
| Decile 9 | 0.399339 |
| Decile 8 | 0.356062 |
| Decile 7 | 0.32788 |
| Decile 6 | 0.306009 |
| Median | 0.28722 |
| Decile 4 | 0.26988 |
| Decile 3 | 0.25297 |
| Decile 2 | 0.23504 |
| Decile 1 | 0.212741 |
| Minimum | 0.0321126 |
|

|
- Mean = 0.298291
- Std.dev = 0.0753176
- 1250 items above graph maximum of 0.585937
|
2 Instances
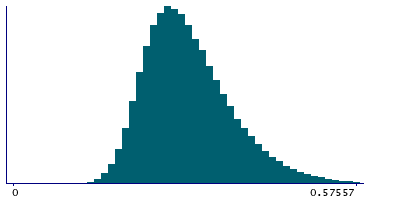
Instance 0 : Initial assessment visit (2006-2010) at which participants were recruited and consent given
488,083 participants, 488,083 items
| Maximum | 0.980769 |
| Decile 9 | 0.39867 |
| Decile 8 | 0.355459 |
| Decile 7 | 0.3274 |
| Decile 6 | 0.305591 |
| Median | 0.286848 |
| Decile 4 | 0.2696 |
| Decile 3 | 0.252736 |
| Decile 2 | 0.23484 |
| Decile 1 | 0.2126 |
| Minimum | 0.0321126 |
|
|
- Mean = 0.297914
- Std.dev = 0.0751341
- 1195 items above graph maximum of 0.58474
|
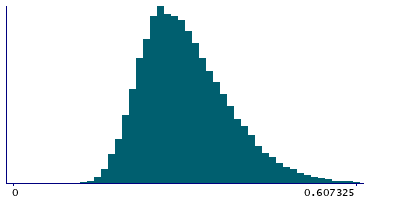
Instance 1 : First repeat assessment visit (2012-13)
19,877 participants, 19,877 items
| Maximum | 0.87327 |
| Decile 9 | 0.41376 |
| Decile 8 | 0.36968 |
| Decile 7 | 0.3403 |
| Decile 6 | 0.316945 |
| Median | 0.296473 |
| Decile 4 | 0.277745 |
| Decile 3 | 0.259155 |
| Decile 2 | 0.24042 |
| Decile 1 | 0.216613 |
| Minimum | 0.10303 |
|
|
- Mean = 0.307543
- Std.dev = 0.0791288
- 41 items above graph maximum of 0.610907
|
Notes
Free Cholesterol in HDL from Nightingale Health data. Biomarker group: Free cholesterol
1 Related Data-Field
| Field ID | Description | Relationship |
|---|
| 23722 | Free Cholesterol in HDL, QC Flag | Field 23722 is the QC flag for Current Field |
Problem running reference query
0 Resources
There are no matching Resources
