Data
507,960 items of data are available, covering 488,512 participants.
Defined-instances run from 0 to 1, labelled using Instancing
2.
Units of measurement are mmol/l.
| Maximum | 3.68648 |
| Decile 9 | 1.6351 |
| Decile 8 | 1.5033 |
| Decile 7 | 1.4131 |
| Decile 6 | 1.33872 |
| Median | 1.2704 |
| Decile 4 | 1.2035 |
| Decile 3 | 1.1329 |
| Decile 2 | 1.05317 |
| Decile 1 | 0.944334 |
| Minimum | 0.2301 |
|
|
- Mean = 1.28316
- Std.dev = 0.273593
- 567 items above graph maximum of 2.32587
|
2 Instances
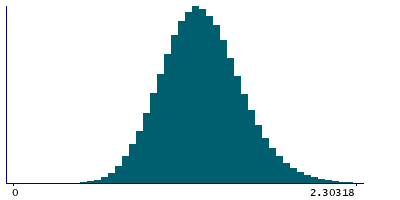
Instance 0 : Initial assessment visit (2006-2010) at which participants were recruited and consent given
488,083 participants, 488,083 items
| Maximum | 3.68648 |
| Decile 9 | 1.63504 |
| Decile 8 | 1.5032 |
| Decile 7 | 1.41303 |
| Decile 6 | 1.3387 |
| Median | 1.27057 |
| Decile 4 | 1.20371 |
| Decile 3 | 1.1332 |
| Decile 2 | 1.0538 |
| Decile 1 | 0.945328 |
| Minimum | 0.2301 |
|

|
- Mean = 1.28342
- Std.dev = 0.273222
- 539 items above graph maximum of 2.32476
|
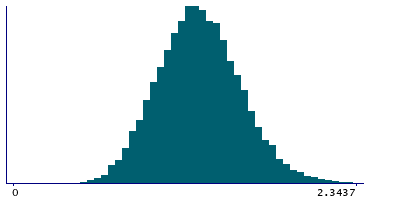
Instance 1 : First repeat assessment visit (2012-13)
19,877 participants, 19,877 items
| Maximum | 2.95042 |
| Decile 9 | 1.63585 |
| Decile 8 | 1.5078 |
| Decile 7 | 1.41565 |
| Decile 6 | 1.3389 |
| Median | 1.2673 |
| Decile 4 | 1.19832 |
| Decile 3 | 1.1241 |
| Decile 2 | 1.0371 |
| Decile 1 | 0.920745 |
| Minimum | 0.35917 |
|
|
- Mean = 1.2769
- Std.dev = 0.282479
- 26 items above graph maximum of 2.35095
|


