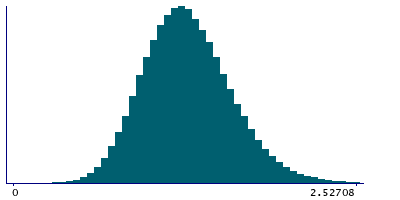
Data
507,960 items of data are available, covering 488,512 participants.
Defined-instances run from 0 to 1, labelled using Instancing
2.
Units of measurement are mmol/l.
| Maximum | 4.4657 |
| Decile 9 | 1.73384 |
| Decile 8 | 1.56989 |
| Decile 7 | 1.4587 |
| Decile 6 | 1.3663 |
| Median | 1.28314 |
| Decile 4 | 1.2027 |
| Decile 3 | 1.11913 |
| Decile 2 | 1.02449 |
| Decile 1 | 0.90009 |
| Minimum | 2.05804e-14 |
|
|
- Mean = 1.30403
- Std.dev = 0.330999
- 577 items above graph maximum of 2.56759
|
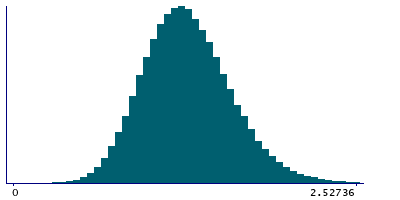
2 Instances
Instance 0 : Initial assessment visit (2006-2010) at which participants were recruited and consent given
488,083 participants, 488,083 items
| Maximum | 4.4657 |
| Decile 9 | 1.73497 |
| Decile 8 | 1.5707 |
| Decile 7 | 1.4595 |
| Decile 6 | 1.36726 |
| Median | 1.28399 |
| Decile 4 | 1.2035 |
| Decile 3 | 1.11995 |
| Decile 2 | 1.02544 |
| Decile 1 | 0.901279 |
| Minimum | 2.05804e-14 |
|
|
- Mean = 1.30498
- Std.dev = 0.330975
- 547 items above graph maximum of 2.56865
|
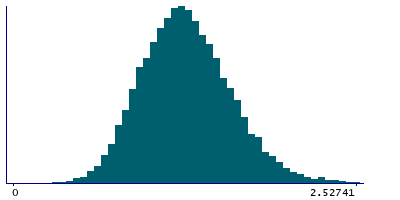
Instance 1 : First repeat assessment visit (2012-13)
19,877 participants, 19,877 items
| Maximum | 3.21357 |
| Decile 9 | 1.70415 |
| Decile 8 | 1.5475 |
| Decile 7 | 1.4369 |
| Decile 6 | 1.3438 |
| Median | 1.26065 |
| Decile 4 | 1.18255 |
| Decile 3 | 1.09754 |
| Decile 2 | 0.999102 |
| Decile 1 | 0.874945 |
| Minimum | 0.11998 |
|
|
- Mean = 1.28074
- Std.dev = 0.330726
- 28 items above graph maximum of 2.53335
|


