Data
507,960 items of data are available, covering 488,512 participants.
Defined-instances run from 0 to 1, labelled using Instancing
2.
Units of measurement are mmol/l.
| Maximum | 9.647 |
| Decile 9 | 4.29269 |
| Decile 8 | 3.9708 |
| Decile 7 | 3.7477 |
| Decile 6 | 3.5636 |
| Median | 3.39418 |
| Decile 4 | 3.224 |
| Decile 3 | 3.0453 |
| Decile 2 | 2.8386 |
| Decile 1 | 2.5518 |
| Minimum | 0.51276 |
|
|
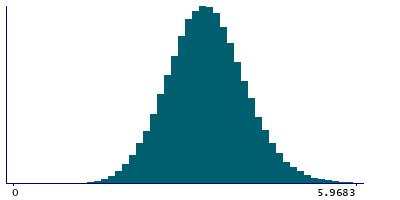
- Mean = 3.41357
- Std.dev = 0.689655
- 513 items above graph maximum of 6.03358
|
2 Instances
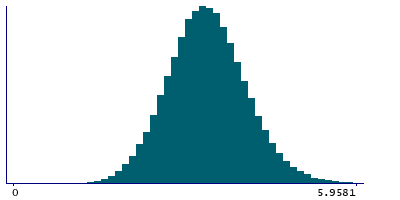
Instance 0 : Initial assessment visit (2006-2010) at which participants were recruited and consent given
488,083 participants, 488,083 items
| Maximum | 9.647 |
| Decile 9 | 4.29162 |
| Decile 8 | 3.9703 |
| Decile 7 | 3.74697 |
| Decile 6 | 3.56336 |
| Median | 3.39424 |
| Decile 4 | 3.22449 |
| Decile 3 | 3.04604 |
| Decile 2 | 2.84019 |
| Decile 1 | 2.5546 |
| Minimum | 0.51276 |
|
|
- Mean = 3.41388
- Std.dev = 0.688329
- 484 items above graph maximum of 6.02865
|
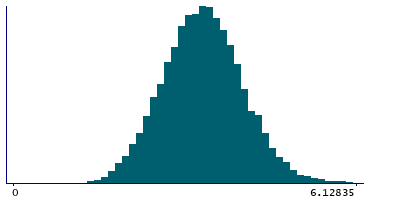
Instance 1 : First repeat assessment visit (2012-13)
19,877 participants, 19,877 items
| Maximum | 8.08328 |
| Decile 9 | 4.32323 |
| Decile 8 | 3.98055 |
| Decile 7 | 3.76435 |
| Decile 6 | 3.57135 |
| Median | 3.39305 |
| Decile 4 | 3.2116 |
| Decile 3 | 3.024 |
| Decile 2 | 2.7991 |
| Decile 1 | 2.4891 |
| Minimum | 0.78342 |
|
|
- Mean = 3.40586
- Std.dev = 0.721418
- 30 items above graph maximum of 6.15737
|


